As we gather
- Sit with your assigned group.
- Re-introduce yourselves!
- Discuss: What is one of your biggest fears?
- Open today’s Rmd.
Announcements
- Thursday at 11:15am - MSCS Coffee Break
Where are we?
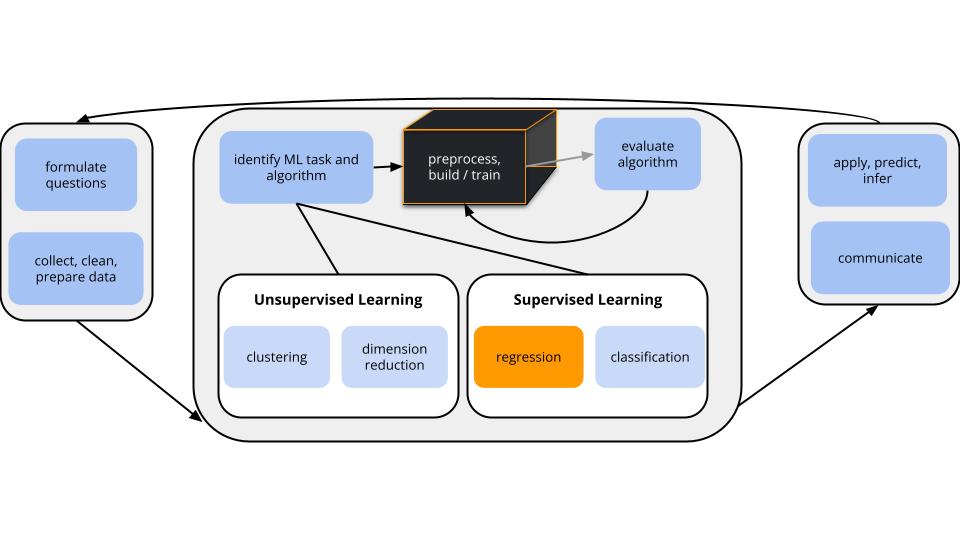
CONTEXT
world = supervised learning
We want to model some output variable \(y\) using a set of potential predictors \((x_1, x_2, ..., x_p)\).
task = regression
\(y\) is quantitative
(nonparametric) algorithm
Our usual parametric models (eg: linear regression) are too rigid to represent the relationship between \(y\) and our predictors \(x\). Thus we need more flexible nonparametric models.
KNN Recap
EXAMPLE 1: KNN (Review)
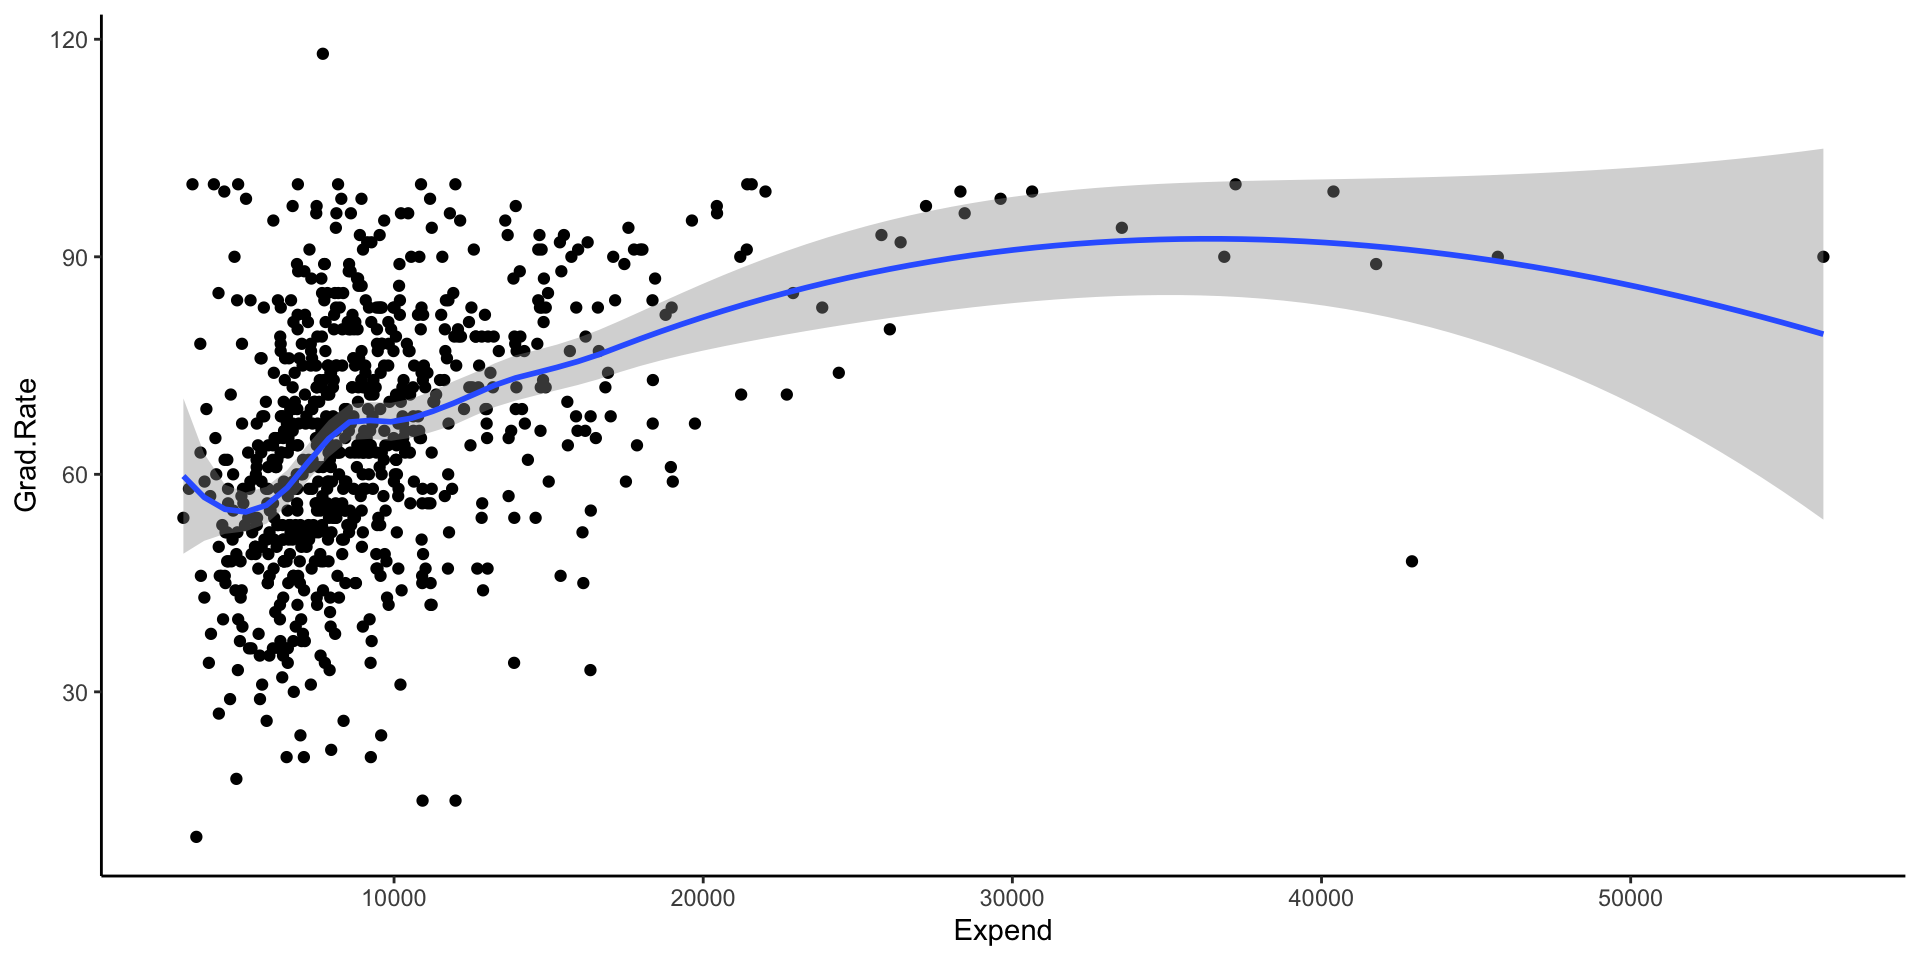
In the previous activity, we modeled college Grad.Rate versus Expend, Enroll, and Private using data on 775 schools.
- We chose the KNN with K = 33 because it minimized the CV MAE, i.e. the errors when predicting grad rate for schools outside our sample. We don’t typically worry about a more parsimonious KNN, i.e. a model that has slightly higher prediction errors but is easier to interpret, apply, etc. Why?
- The output of the model is: one prediction for a one observational unit. There is nothing to interpret (no plots, no coefficients, etc).
- There is no way to tune the model to use fewer predictors.
- What assumptions did the KNN model make about the relationship of
Grad.Rate with Expend, Enroll, and Private? Is this a pro or con?
- The only assumption we made was that the outcome values of \(y\) should be similar if the predictor values of \(x\) are similar. No other assumptions are made.
- This is a pro if we want flexibility due to non-linear relationships and that assumption is true; This is a con if relationships are actually linear or could be modeled with a parametric model.
- What did the KNN model tell us about the relationship of
Grad.Rate with Expend, Enroll, and Private? For example, did it give you a sense of whether grad rates are higher at private or public institutions? At institutions with higher or lower enrollments? Is this a pro or con?
- Nothing
- Nothing to interpret, so the model is more of a black box in terms of knowing why it gives you a particular prediction. I’d say this is a con.
Small Group Discussion: Parametric v. Nonparametric
EXAMPLE 2: nonparametric KNN vs parametric least squares and LASSO
- When should we use a nonparametric algorithm like KNN?
- When shouldn’t we?
- Use nonparametric methods when parametric model assumptions are too rigid. Forcing a parametric method in this situation can produce misleading conclusions.
- Use parametric methods when the model assumptions hold. In such cases, parametric models provide more contextual insight (eg: meaningful coefficients) and the ability to detect which predictors are beneficial to the model.
Notes: LOESS
Local Regression or Locally Estimated Scatterplot Smoothing (LOESS)
Goal:
Build a flexible regression model of \(y\) by one quantitative predictor \(x\),
\[y = f(x) + \varepsilon\]
Idea:
Fit regression models in small localized regions, where nearby data have greater influence than far data.
Algorithm:
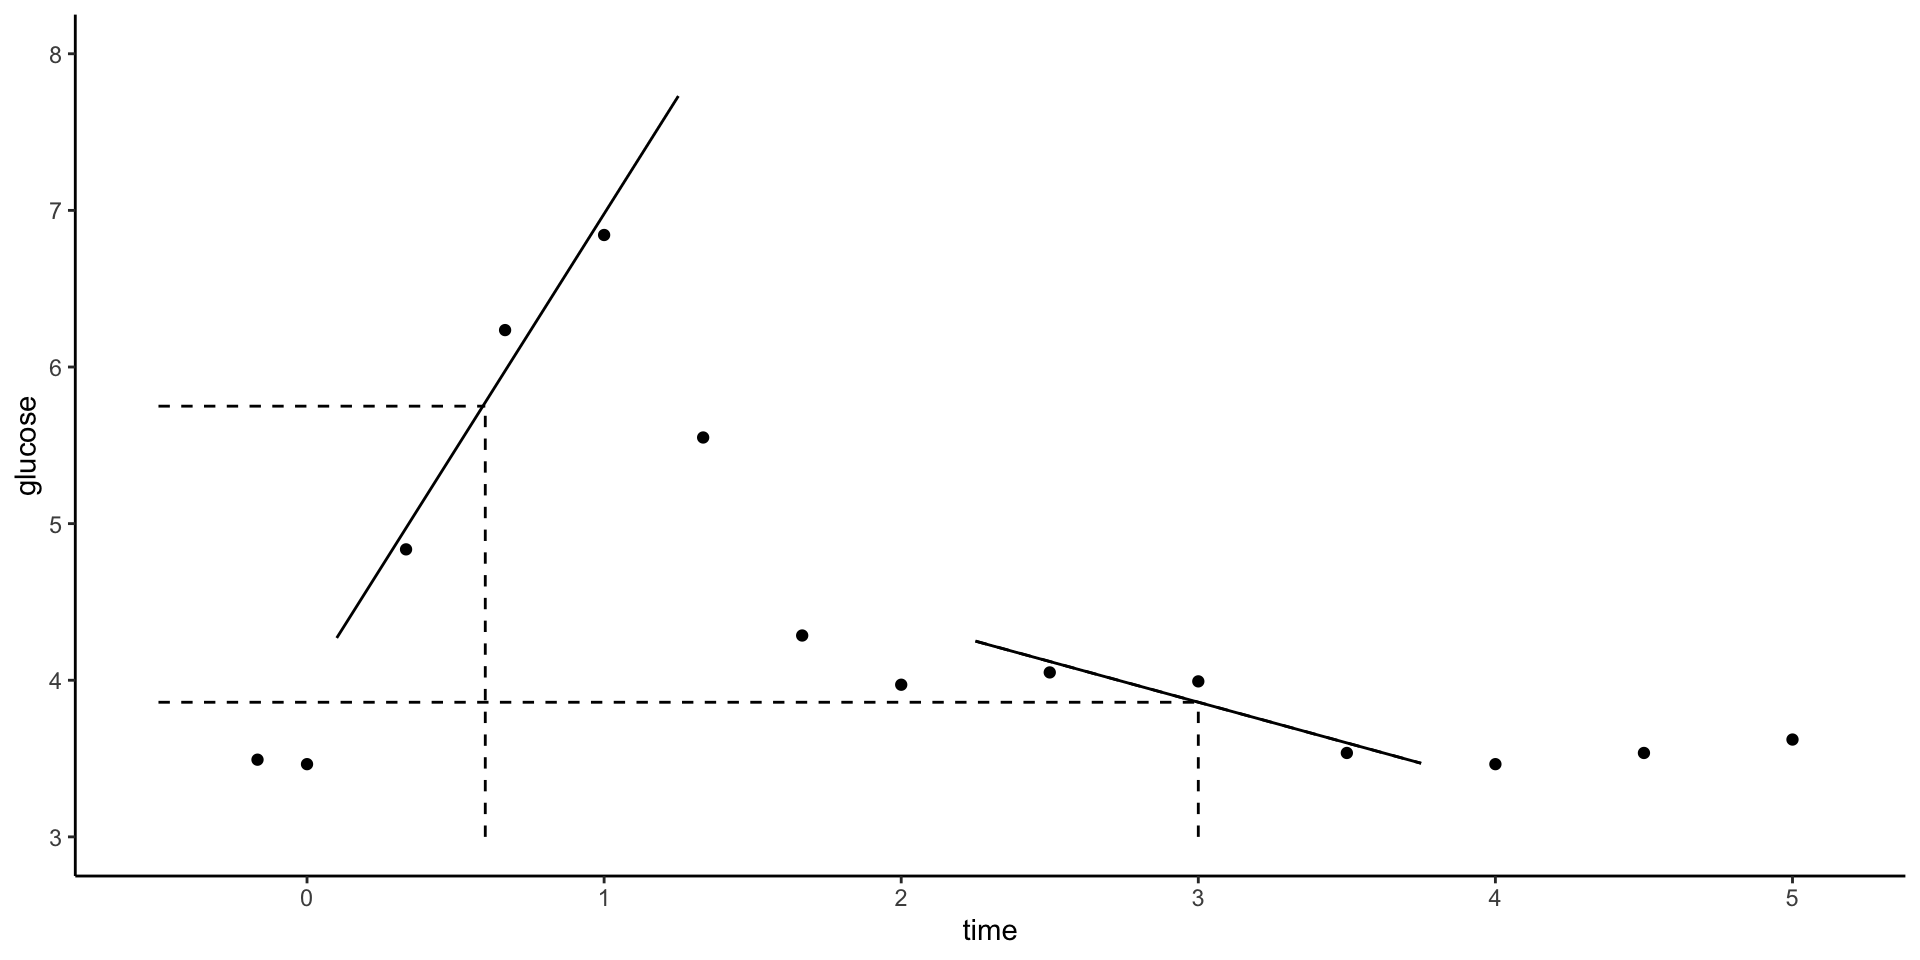
Define the span, aka bandwidth, tuning parameter \(h\) where \(0 \le h \le 1\). Take the following steps to estimate \(f(x)\) at each possible predictor value \(x\):
- Identify a neighborhood consisting of the \(100∗h\)% of cases that are closest to \(x\).
- Putting more weight on the neighbors closest to \(x\) (ie. allowing them to have more influence), fit a linear model in this neighborhood.
- Use the local linear model to estimate f(x).
Small Group Discussion: Recap Video
EXAMPLE 3: LOESS in R
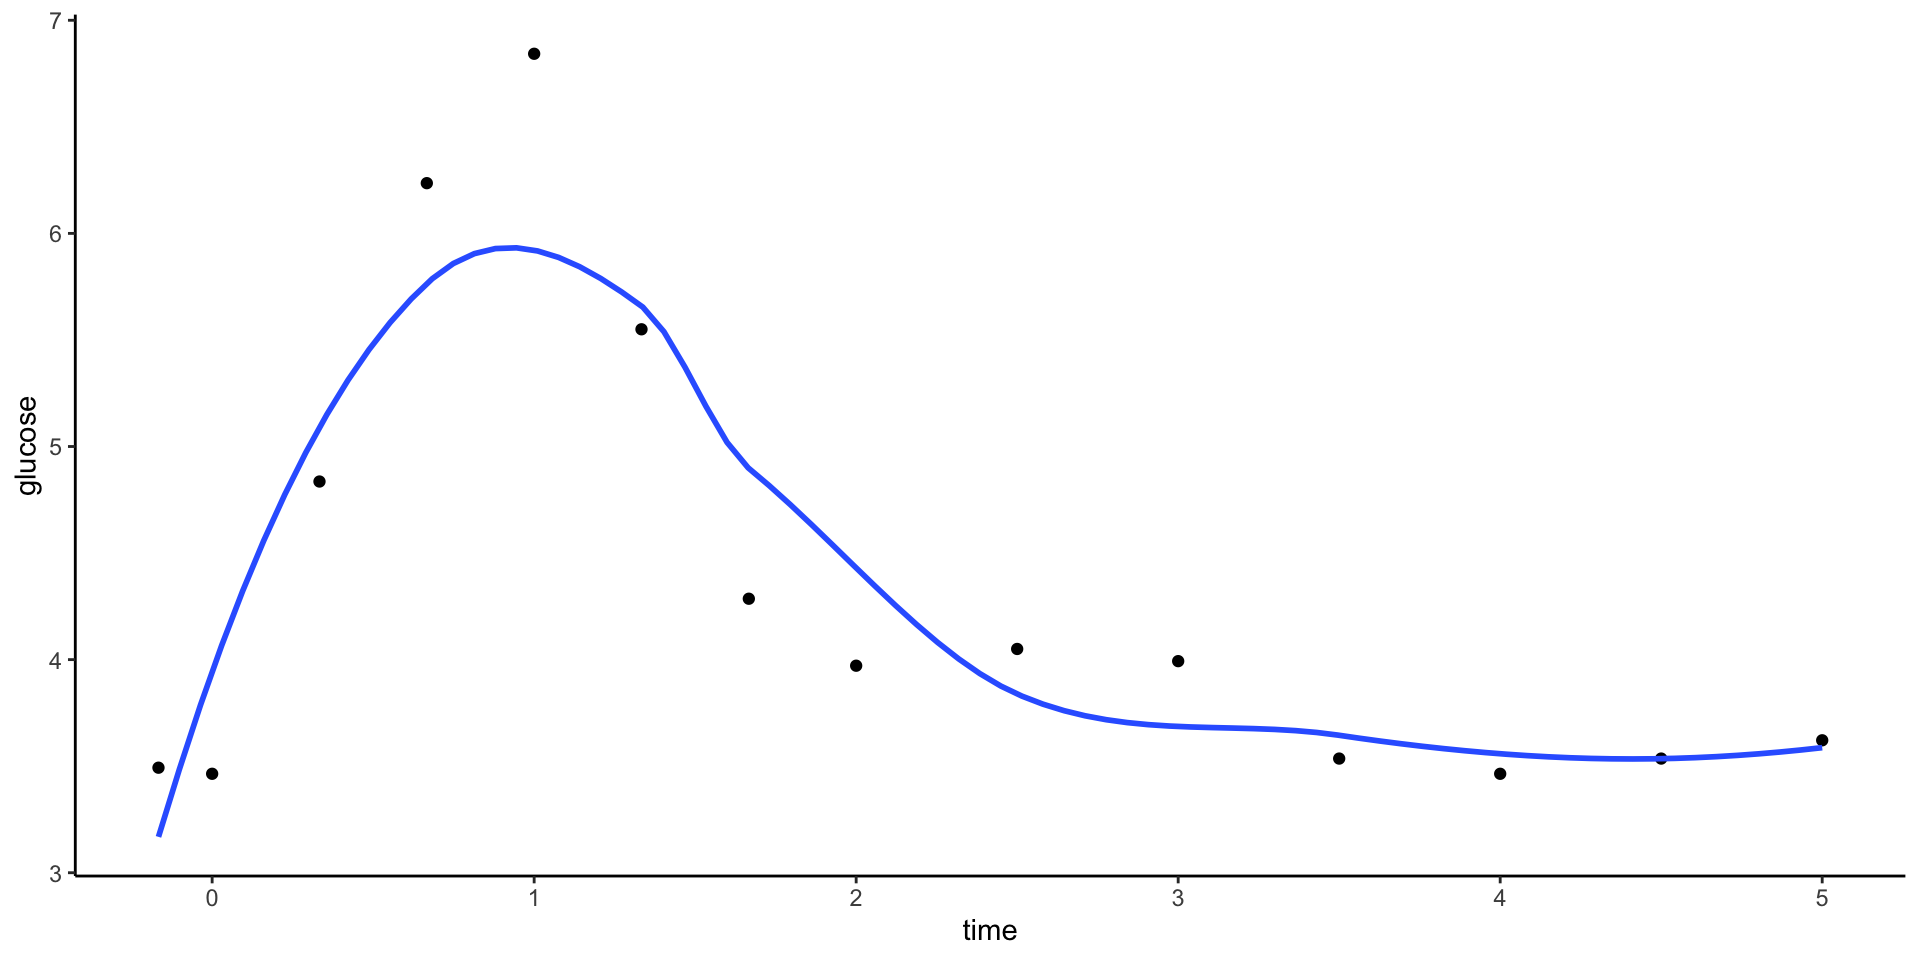
We can plot LOESS models using geom_smooth(). Play around with the span parameter below.
- What happens as we increase the span from roughly 0 to roughly 1?
- What is one “pro” of this nonparametric algorithm, relative to KNN?
- What questions do you have about this algorithm?
Note: You’ll find that you can specify span greater than 1. Use your resources to figure out what that means in terms of the algorithm.
Small Group Discussion: Recap Video
EXAMPLE 4: LOESS & the Bias-Variance Tradeoff
Open the Rmd. Go to Example 4.
Run the shiny app code and explore the impact of the span tuning parameter h on the LOESS performance across different datasets. Continue to click the Go! button to get different datasets.
For what values of h do you get the following:
- high bias but low variance
- low bias but high variance
- moderate bias and low variance
- h near 1
- h near 0
- h somewhere in the middle
Notes: GAM
Generalized Additive Models (GAM)
GAMs are nonparametric nonlinear models that can handle more than one predictor. They incorporate each predictor \(x_i\) through some nonparametric, smooth function \(f_i()\):
\[y = \beta_0 + f_1(x_1) + f_2(x_2) + \cdots + f_p(x_p) + \varepsilon\]
Big ideas
- Each \(f_j(x_j)\) is a smooth model of \(y\) vs \(x_j\) when controlling for the other predictors. More specifically:
- Each \(f_j(x_j)\) models the behavior in \(y\) that’s not explained by the other predictors.
- This “unexplained behavior” is represented by the residuals from the model of \(y\) versus all predictors.
- The \(f_j()\) functions are estimated using some smoothing algorithm (e.g. LOESS, smoothing splines, etc).
TECHNICAL NOTE
In tidymodels():
The GAM f(x) components are estimated using smoothing splines, a nonparametric smoothing technique that’s more nuanced than LOESS.
Smoothing splines depend upon a \(\lambda\) penalty tuning parameter (labeled adjust_deg_free in tidymodels). As in the LASSO:
- the bigger the \(\lambda\), the more simple / less wiggly the estimate of f(x)
- if \(\lambda\) is big enough, we might even kick a predictor out of the model
Small Group Discussion
EXAMPLE 5: GAM
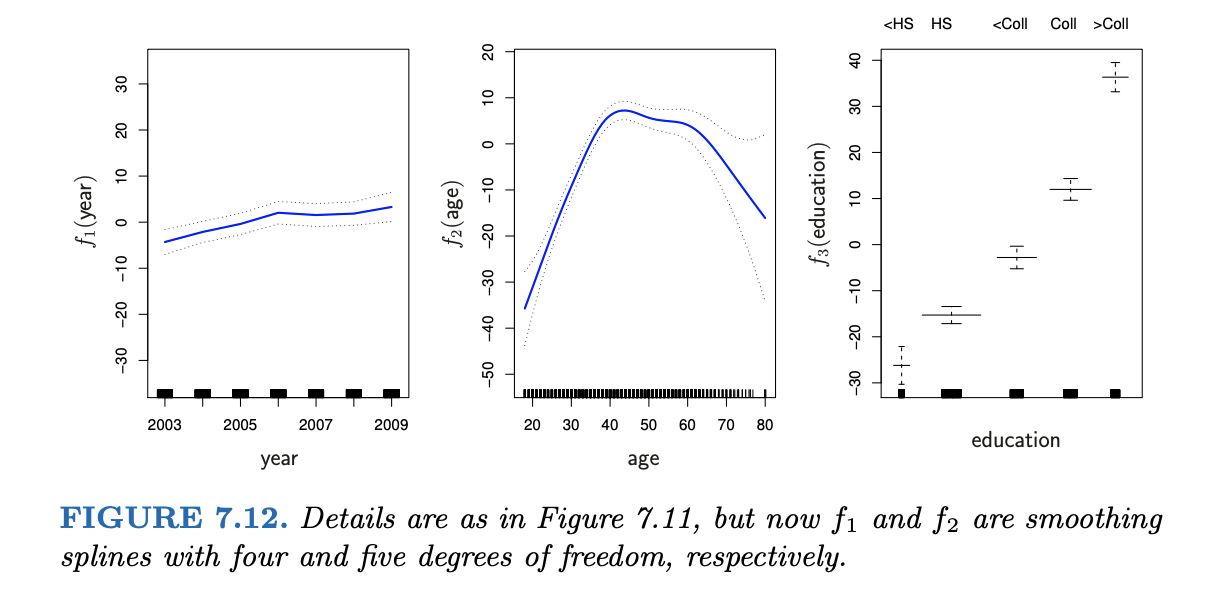
Interpret the wage analysis in Chapter 7 of ISLR.
wage = \(\beta_0\) + f(year) + f(age) + f(education) + \(\varepsilon\)
![]()
Small Group Activity
Work as a group on exercises 1 - 7.
Consider W.A.I.T. Why Am/Aren’t I Talking?
- Actively work to give everyone a chance to contribute and share.
After Class
LOESS & GAM
- Finish the activity, check the solutions, watch the R Tutorial video, and reach out with questions.
- Continue to check in on Slack.
- If you search for me, you’ll find all of the info I’ve posted in our workspace.
Group Assignment
- If you haven’t already, open the Group Assignment 1 in Moodle.
- Next Tuesday You will get and have time to work on the group assignment. If you must miss class, you’re expected to alert your group members and come up with a plan to contribute to the collaboration outside class.
Upcoming due dates
- Friday: HW 2 Revisions
- Next Thursday: HW 4 (posted on Moodle)
- Tuesday Feb 27: Concept Quiz 1 on Units 1–3 (up to and including today)