# A tibble: 6 × 13
  competitorname chocolate fruity caramel peanutyalmondy nougat crispedricewafer
  <chr>          <lgl>     <lgl>  <lgl>   <lgl>          <lgl>  <lgl>
1 100 Grand      TRUE      FALSE  TRUE    FALSE          FALSE  TRUE
2 3 Musketeers   TRUE      FALSE  FALSE   FALSE          TRUE   FALSE
3 One dime       FALSE     FALSE  FALSE   FALSE          FALSE  FALSE
4 One quarter    FALSE     FALSE  FALSE   FALSE          FALSE  FALSE
5 Air Heads      FALSE     TRUE   FALSE   FALSE          FALSE  FALSE
6 Almond Joy     TRUE      FALSE  FALSE   TRUE           FALSE  FALSE
# ℹ 6 more variables: hard <lgl>, bar <lgl>, pluribus <lgl>,
# sugarpercent <dbl>, pricepercent <dbl>, winpercent <dbl>Random forests & bagging
Brianna Heggeseth
As we gather
- Sit with your assigned group.
- Introduce yourself!
- What is your favorite thing to do in the snow?
- Open today’s Rmd
Announcements
MSCS Events
Thursday at 11:15am - MSCS Coffee Break
- Smail Gallery
This weekend, Data Fest
Monday, March 25, 4:45pm, JBD: MSCS & Society Lecture
- “Designing Mixed-Reality and Tangible Data Experiences with Artists and Indigenous Communities” by Dr. Daniel Keefe, U of M
Textbook
Let’s check out the table of contents…
We’ve covered so far:
- Chapter 2
- Chapter 3
- Chapter 4 (except 4.4 - 4.6, not covering)
- Chapter 5
- Chapter 6 (except 6.3, but we’ll get there)
- Chapter 7 (spent little time on 7.4)
- Chapter 8 (doing more today…)
After this, we’ll cover:
- Chapter 12
- Chapter 6.3
- For Chp 10, take Introduction to Artificial Intelligence
- For Chp 11, take Survival Analysis
Where are we?
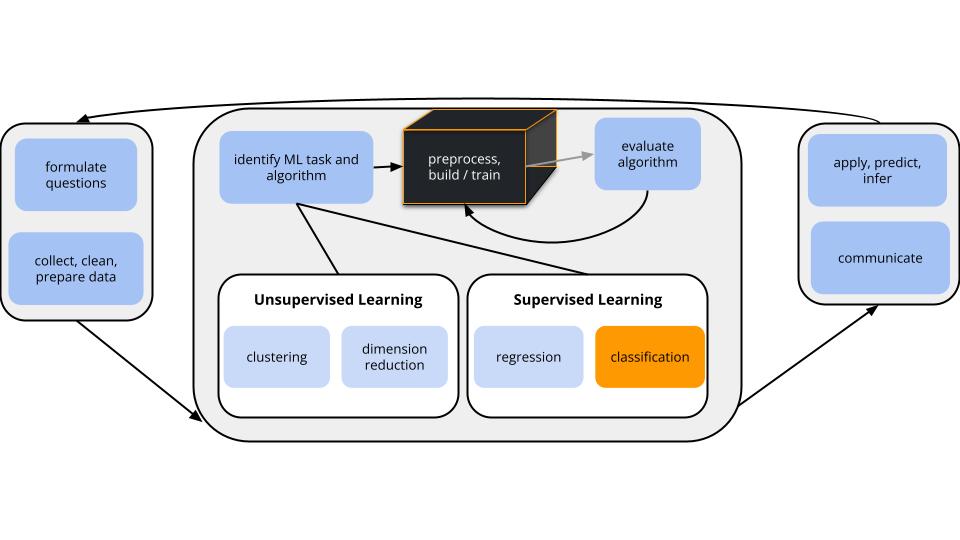
CONTEXT
world = supervised learning
We want to model some output variable \(y\) using a set of potential predictors (\(x_1, x_2, ..., x_p\)).task = CLASSIFICATION
\(y\) is categoricalalgorithm = NONparametric
GOAL
Add more nonparametric algorithms to our toolkit: random forests & bagging
EXAMPLE 1
What does the word “forest” mean to you?
EXAMPLE 2: Candy Data
Write R code to find out the following:
- What are the 6 most popular candies (as defined by
winpercent)? - The least popular?
# A tibble: 85 × 13
   competitorname              chocolate fruity caramel peanutyalmondy nougat
   <chr>                       <lgl>     <lgl>  <lgl>   <lgl>          <lgl>
 1 Reese's Peanut Butter cup   TRUE      FALSE  FALSE   TRUE           FALSE
 2 Reese's Miniatures          TRUE      FALSE  FALSE   TRUE           FALSE
 3 Twix                        TRUE      FALSE  TRUE    FALSE          FALSE
 4 Kit Kat                     TRUE      FALSE  FALSE   FALSE          FALSE
 5 Snickers                    TRUE      FALSE  TRUE    TRUE           TRUE
 6 Reese's pieces              TRUE      FALSE  FALSE   TRUE           FALSE
 7 Milky Way                   TRUE      FALSE  TRUE    FALSE          TRUE
 8 Reese's stuffed with pieces TRUE      FALSE  FALSE   TRUE           FALSE
 9 Peanut butter M&M's         TRUE      FALSE  FALSE   TRUE           FALSE
10 Nestle Butterfinger         TRUE      FALSE  FALSE   TRUE           FALSE
# ℹ 75 more rows
# ℹ 7 more variables: crispedricewafer <lgl>, hard <lgl>, bar <lgl>,
# pluribus <lgl>, sugarpercent <dbl>, pricepercent <dbl>, winpercent <dbl># A tibble: 6 × 13
competitorname chocolate fruity caramel peanutyalmondy nougat crispedricewafer
<chr> <lgl> <lgl> <lgl> <lgl> <lgl> <lgl>
1 Reese's Peanu… TRUE FALSE FALSE TRUE FALSE FALSE
2 Reese's Minia… TRUE FALSE FALSE TRUE FALSE FALSE
3 Twix TRUE FALSE TRUE FALSE FALSE TRUE
4 Kit Kat TRUE FALSE FALSE FALSE FALSE TRUE
5 Snickers TRUE FALSE TRUE TRUE TRUE FALSE
6 Reese's pieces TRUE FALSE FALSE TRUE FALSE FALSE
# ℹ 6 more variables: hard <lgl>, bar <lgl>, pluribus <lgl>,
# sugarpercent <dbl>, pricepercent <dbl>, winpercent <dbl># A tibble: 6 × 13
competitorname chocolate fruity caramel peanutyalmondy nougat crispedricewafer
<chr> <lgl> <lgl> <lgl> <lgl> <lgl> <lgl>
1 Nik L Nip FALSE TRUE FALSE FALSE FALSE FALSE
2 Boston Baked … FALSE FALSE FALSE TRUE FALSE FALSE
3 Chiclets FALSE TRUE FALSE FALSE FALSE FALSE
4 Super Bubble FALSE TRUE FALSE FALSE FALSE FALSE
5 Jawbusters FALSE TRUE FALSE FALSE FALSE FALSE
6 Root Beer Bar… FALSE FALSE FALSE FALSE FALSE FALSE
# ℹ 6 more variables: hard <lgl>, bar <lgl>, pluribus <lgl>,
# sugarpercent <dbl>, pricepercent <dbl>, winpercent <dbl>EXAMPLE 3: Build an unpruned tree
New Outcome: Low, Medium, High Candy Popularity
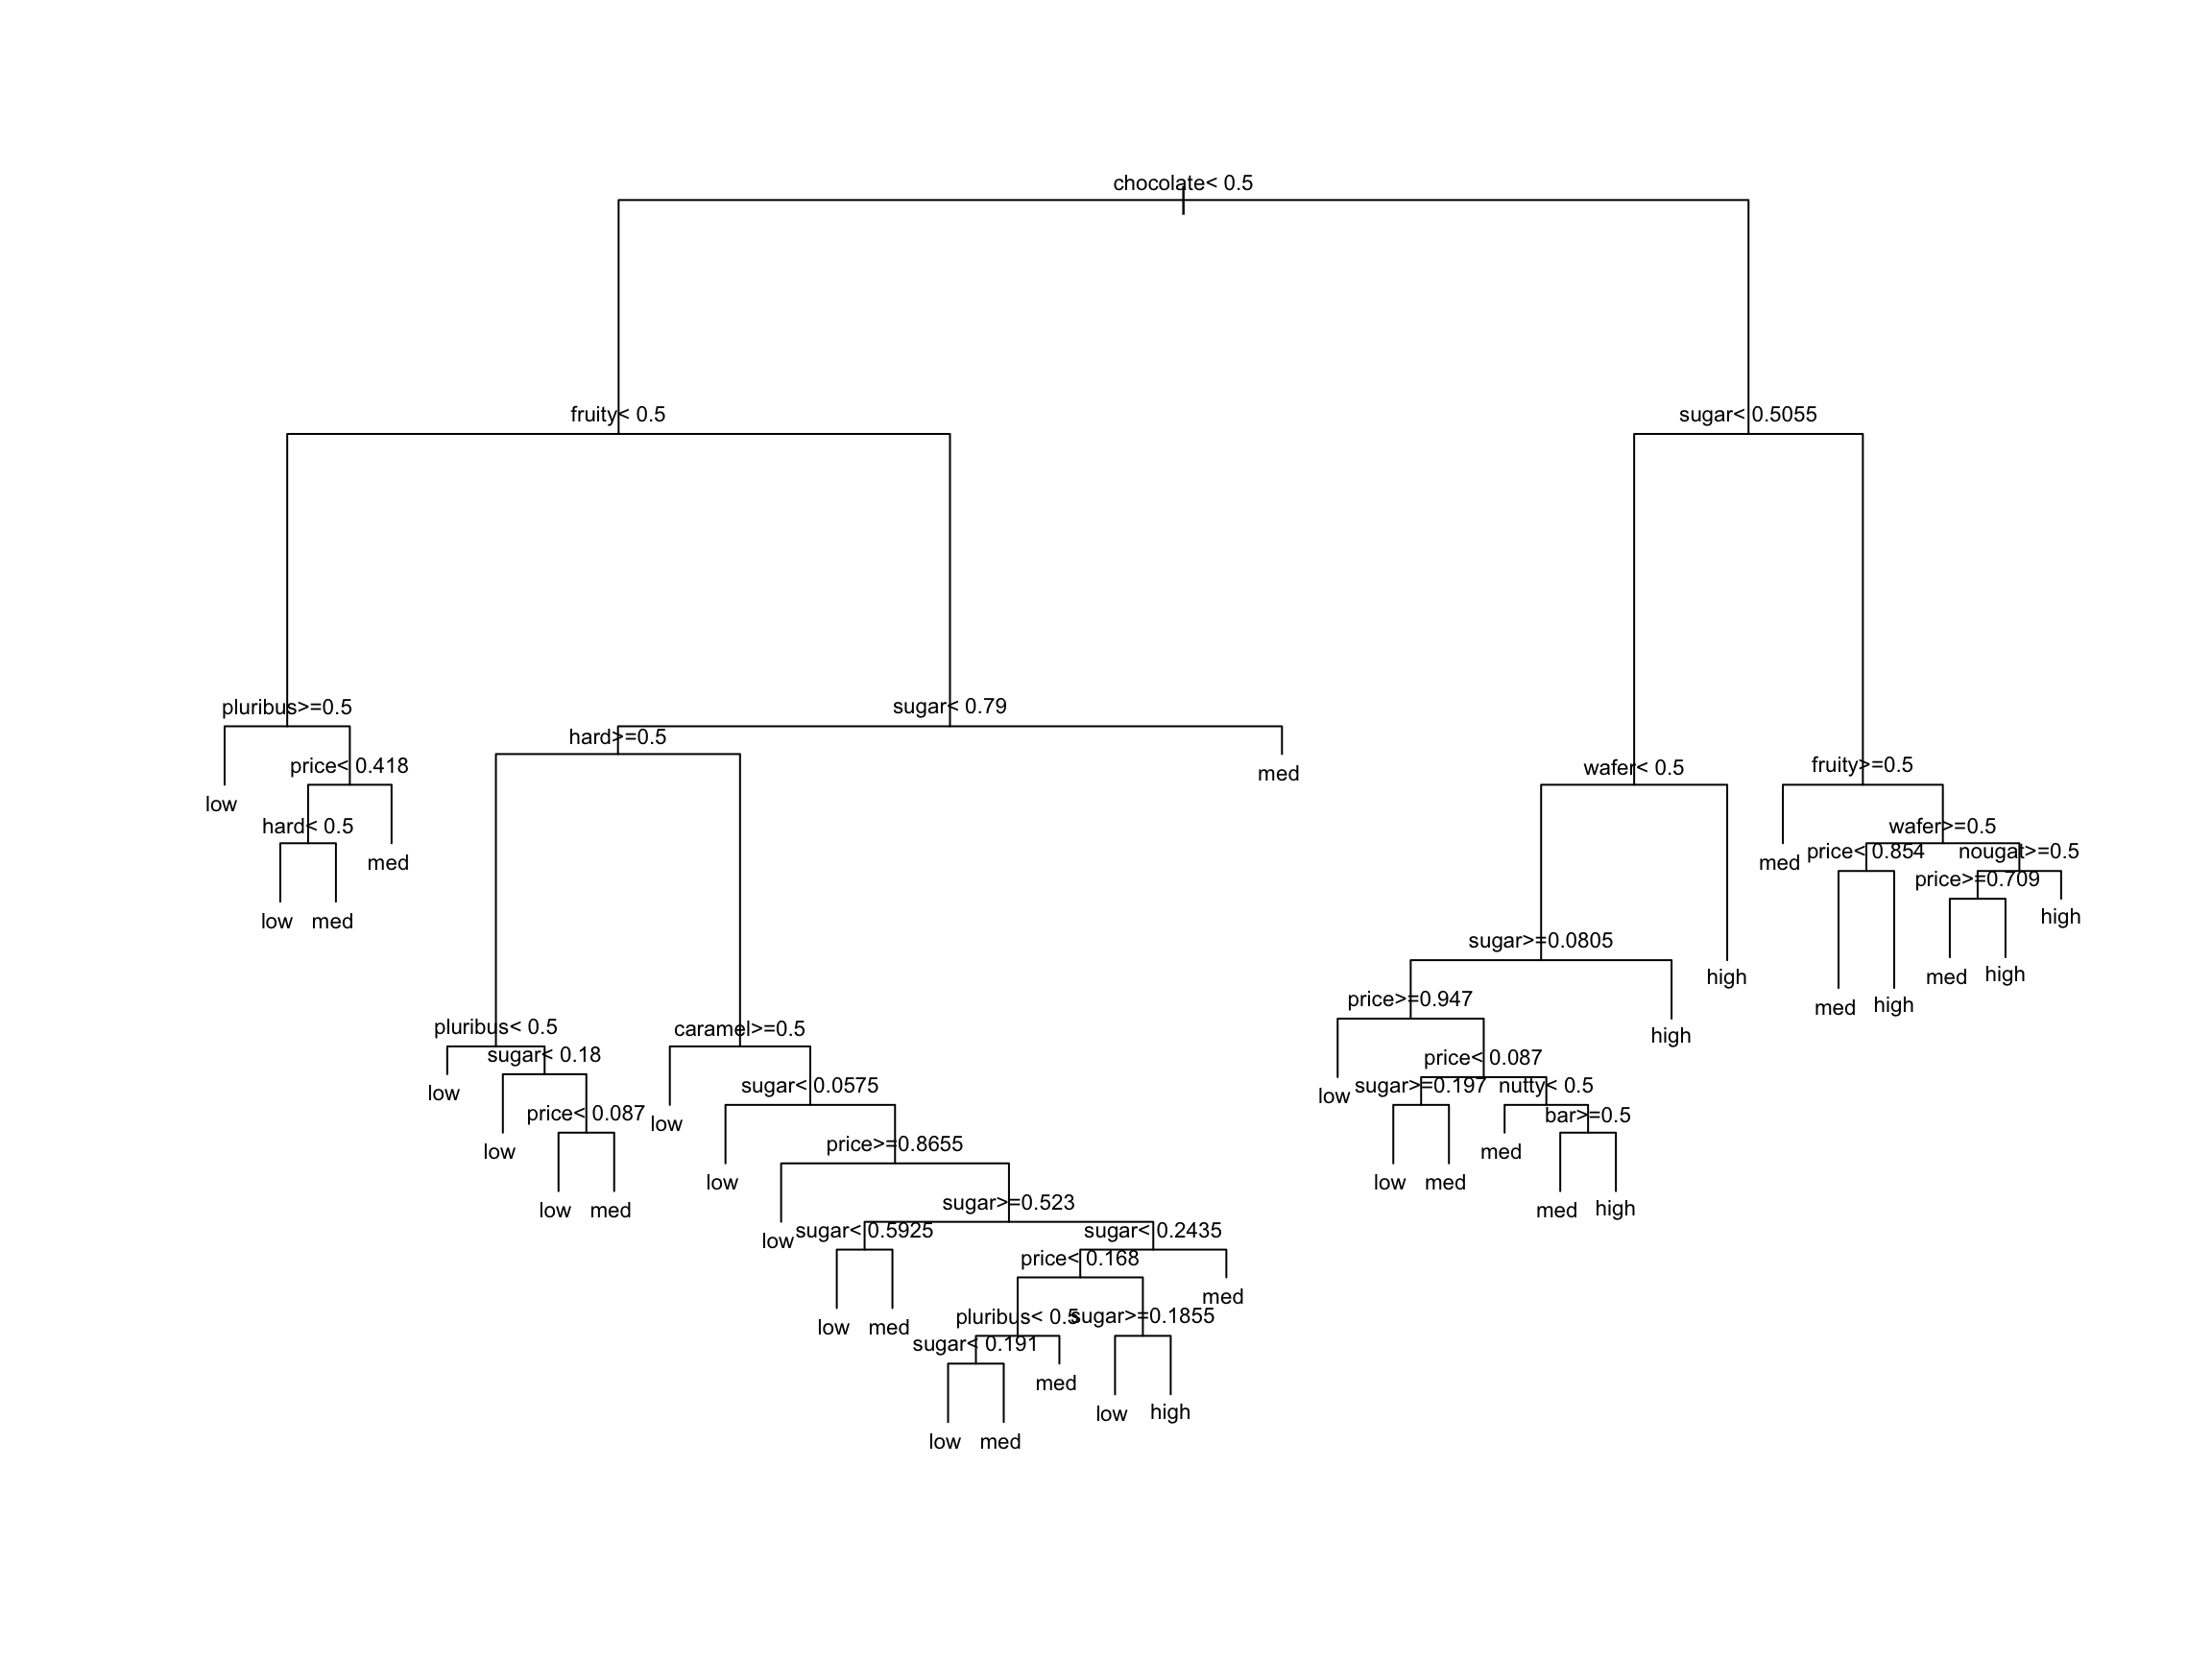
Unpruned trees have…
- low bias, low variance
- low bias, high variance
- high bias, low variance
- high bias, high variance
low bias, high variance!
New Concept
GOAL
Maintain the low bias of an unpruned tree while decreasing variance.
APPROACH
Build a bunch of unpruned trees from different data.
This way, our final result isn’t overfit to our sample data.
THE RUB
We only have 1 set of data…
EXAMPLE 4: Take a REsample of candy
We only have 1 sample of data.
But we can resample it (basically pretending we have a different sample).
Let’s each take our own unique candy resample (also known as bootstrapping):
- Take a sample of 85 candies from the original 85 candies, with replacement.
- Some data points will be sampled multiple times while others aren’t sampled at all.
- On average, 2/3 of the original data points will show up in the resample and 1/3 will be left out. [Mathematical proof of this on course website]
Take your resample:
# Set the seed to YOUR phone number (just the numbers)
set.seed(123456789)

# Take a REsample of candies from our sample
my_candy <- sample_n(candy, size = nrow(candy), replace = TRUE)

# Check it out
head(my_candy, 3)
chocolate fruity caramel nutty nougat wafer hard bar
Snickers Crisper...1 TRUE FALSE TRUE TRUE FALSE TRUE FALSE TRUE
Fruit Chews...2 FALSE TRUE FALSE FALSE FALSE FALSE FALSE FALSE
Nestle Crunch...3 TRUE FALSE FALSE FALSE FALSE TRUE FALSE TRUE
pluribus sugar price popularity
Snickers Crisper...1 FALSE 0.604 0.651 med
Fruit Chews...2 TRUE 0.127 0.034 med
Nestle Crunch...3 FALSE 0.313 0.767 highIn the next exercise, we’ll each build a tree of popularity using our own resample data.
First, check your intuition:
TRUE / FALSE: All of our trees will be the same.
TRUE / FALSE: Our trees will use the same predictor (but possibly a different cut-off) in the first split.
TRUE / FALSE: Our trees will use the same predictors in all splits.
FALSE, FALSE, FALSE
EXAMPLE 5: Build & share YOUR tree
Build and plot a tree using your unique sample (my_candy).
Use your tree to classify Baby Ruth, the 7th candy in the original data.
Finally, share your results!
Record your prediction and paste a picture of your tree into this document.
EXAMPLE 6: Using our FOREST
We now have a group of multiple trees – a forest!
These trees…
- differ from resample to resample
- don’t use the same predictor in each split (not even in the first split)!
- produce different
popularitypredictions for Baby Ruth
Based on our forest of trees (not just your 1 tree), what’s your prediction for Baby Ruth’s popularity?
What do you think are the advantages of predicting candy popularity using a forest instead of a single tree?
Can you anticipate any drawbacks of using forests instead of trees?
Bagging (Bootstrap AGGregatING) & Random Forests
To classify a categorical response variable y using a set of p predictors x:
Take B resamples from the original sample.
- Sample WITH replacement
- Sample size = original sample size n
Use each resample to build an unpruned tree.
- For bagging: consider all p predictors in each split of each tree
- For random forests: at each split in each tree, randomly select and consider only a subset of the predictors (often roughly p/2 or \(\sqrt{p}\))
- For bagging: consider all p predictors in each split of each tree
Use each of the B trees to classify y at a set of predictor values x.
Average the classifications using a majority vote: classify y as the most common classification among the B trees.
Ensemble Methods
Bagging and random forest algorithms are ensemble methods.
They combine the outputs of multiple machine learning algorithms.
As a result, they decrease variability from sample to sample, hence provide more stable predictions / classifications than might be obtained by any algorithm alone.
EXAMPLE 7: pros & cons
Order trees, forests, & bagging algorithms from least to most computationally expensive.
What results will be easier to interpret: trees or forests?
Which of bagging or forests will produce a collection of trees that tend to look very similar to each other, and similar to the original tree? Hence which of these algorithms is more dependent on the sample data, thus will vary more if we change up the data? [both questions have the same answer]
Small Group Activity
For the rest of the class, work together on Exercises 1-7.
After Class
Upcoming due dates
- 3/28 : HW 6
- 4/4 : Concept Quiz 2 (on classification)
- 4/11 : Group Assignment 2