What is your favorite thing to do to relax / take care of yourself?
Announcements
MSCS Events
Thursday at 11:15am - MSCS Coffee Break
This week: MSCS Registration Event (in OLRI 241; 11:30-12:30)
April 11: Beyond Mac (Felicia DeSmith ’05)
April 18: MSCS Seminar (Prof. Laura Lyman)
Registration
New Minors
New Stat, Math, DS minors are coming into effect Fall 2024. See New MSCS Minors for details of the requirements.
Courses to Consider
Comp/Stat 112: Intro to Data Science
Math/Stat 354: Probability (Math 137 prereq)
Comp 123: Core Concepts in CS
Comp/Stat 212: Intermediate Data Science (with me! 112 prereq)
Stat 451: Causal Inference (354 prereq, but can be waived)
Stat/Comp 456: Project in DS (212 prereq)
Concept Quiz 2
Part 1
on paper
closed people, closed laptop
you can bring in an 8.5x11 inch sheet with notes. you can type, write small, write big, etc. you will hand this in with Part 1
Part 1 is due by the end of the class
you might be asked to interpret some R output, but I won’t ask you to provide any code
Part 2
on computers
you can chat with any current STAT 253 student, but nobody else (including preceptors)
you can DM or email me clarifying questions and if there is something confusing, I’ll share my answer with the entire class
you can use any materials from this STAT 253 course (from course site or Moodle or textbook), but no internet, ChatGPT, etc
this is designed to finish during class, but you can hand it in any time within 24 hours of your class end time (eg: 11:10am the next day for the 9:40am section)
Content
Units 1-5 with focus on: Units 4-5
questions range in style, including multiple choice, fill in the blank, short response, matching, etc
Context
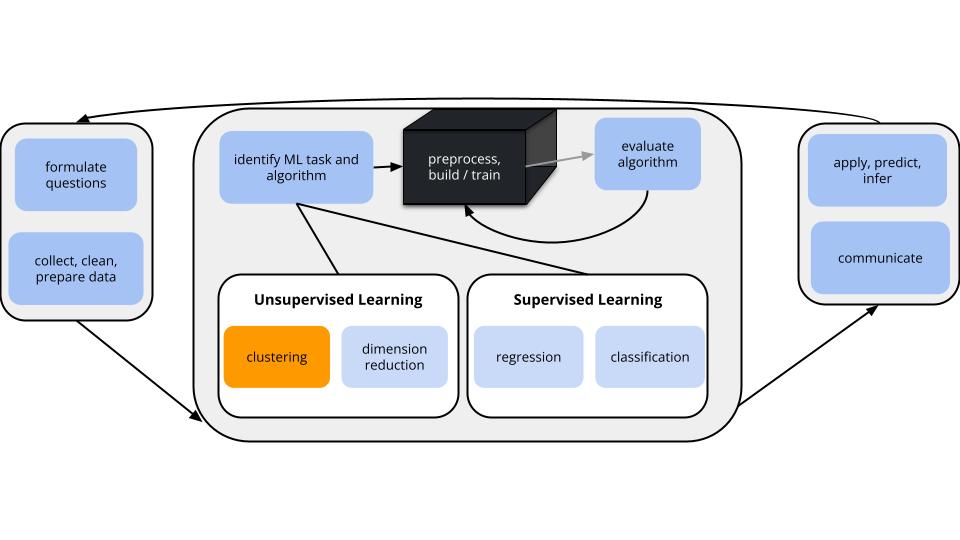
GOALS
Suppose we have a set of feature variables (\(x_1,x_2,...,x_k\)) but NO outcome variable y. Thus instead of our goal being to predict/classify/explain y, we might simply want to…
Examine the structure of our data.
Utilize this examination as a jumping off point for further analysis.
Unsupervised Learning
Cluster analysis
Focus: Structure among the rows, i.e. individual cases or data points.
Goal: Identify and examine clusters or distinct groups of cases with respect to their features x.
Focus: Structure among the columns, i.e. features x.
Goal: Combine groups of correlated features x into a smaller set of uncorrelated features which preserve the majority of information in the data. (We’ll discuss the motivation later!)
Goal:
Create a hierarchy of clusters where clusters consist of similar data points.
Algorithm (agglomerative):
Suppose we have a set of p feature variables (\(x_1, x_2,..., x_p\)) on each of n data points. Each data point starts as a leaf.
Compute the Euclidean distance between all pairs of data points with respect to x.
Fuse the 2 closest data points into a single cluster or branch.
Continue to fuse the 2 closest clusters until all cases are in 1 cluster.
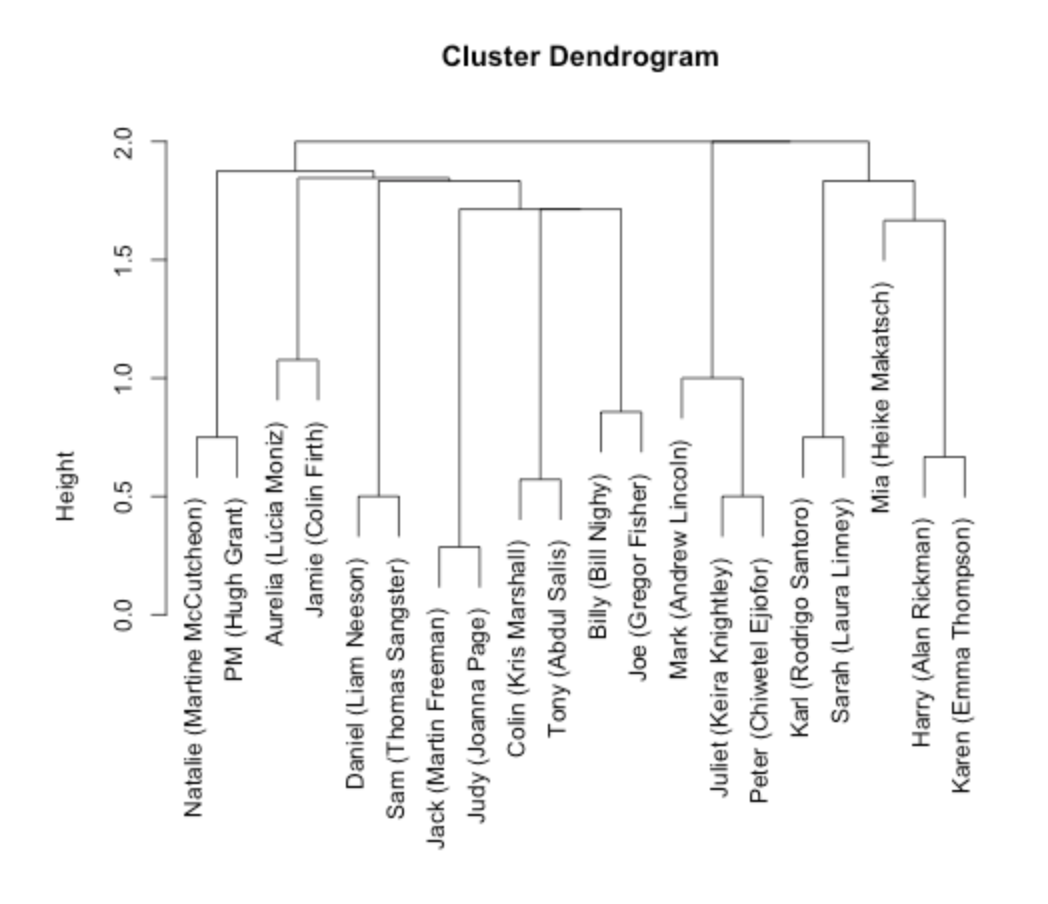
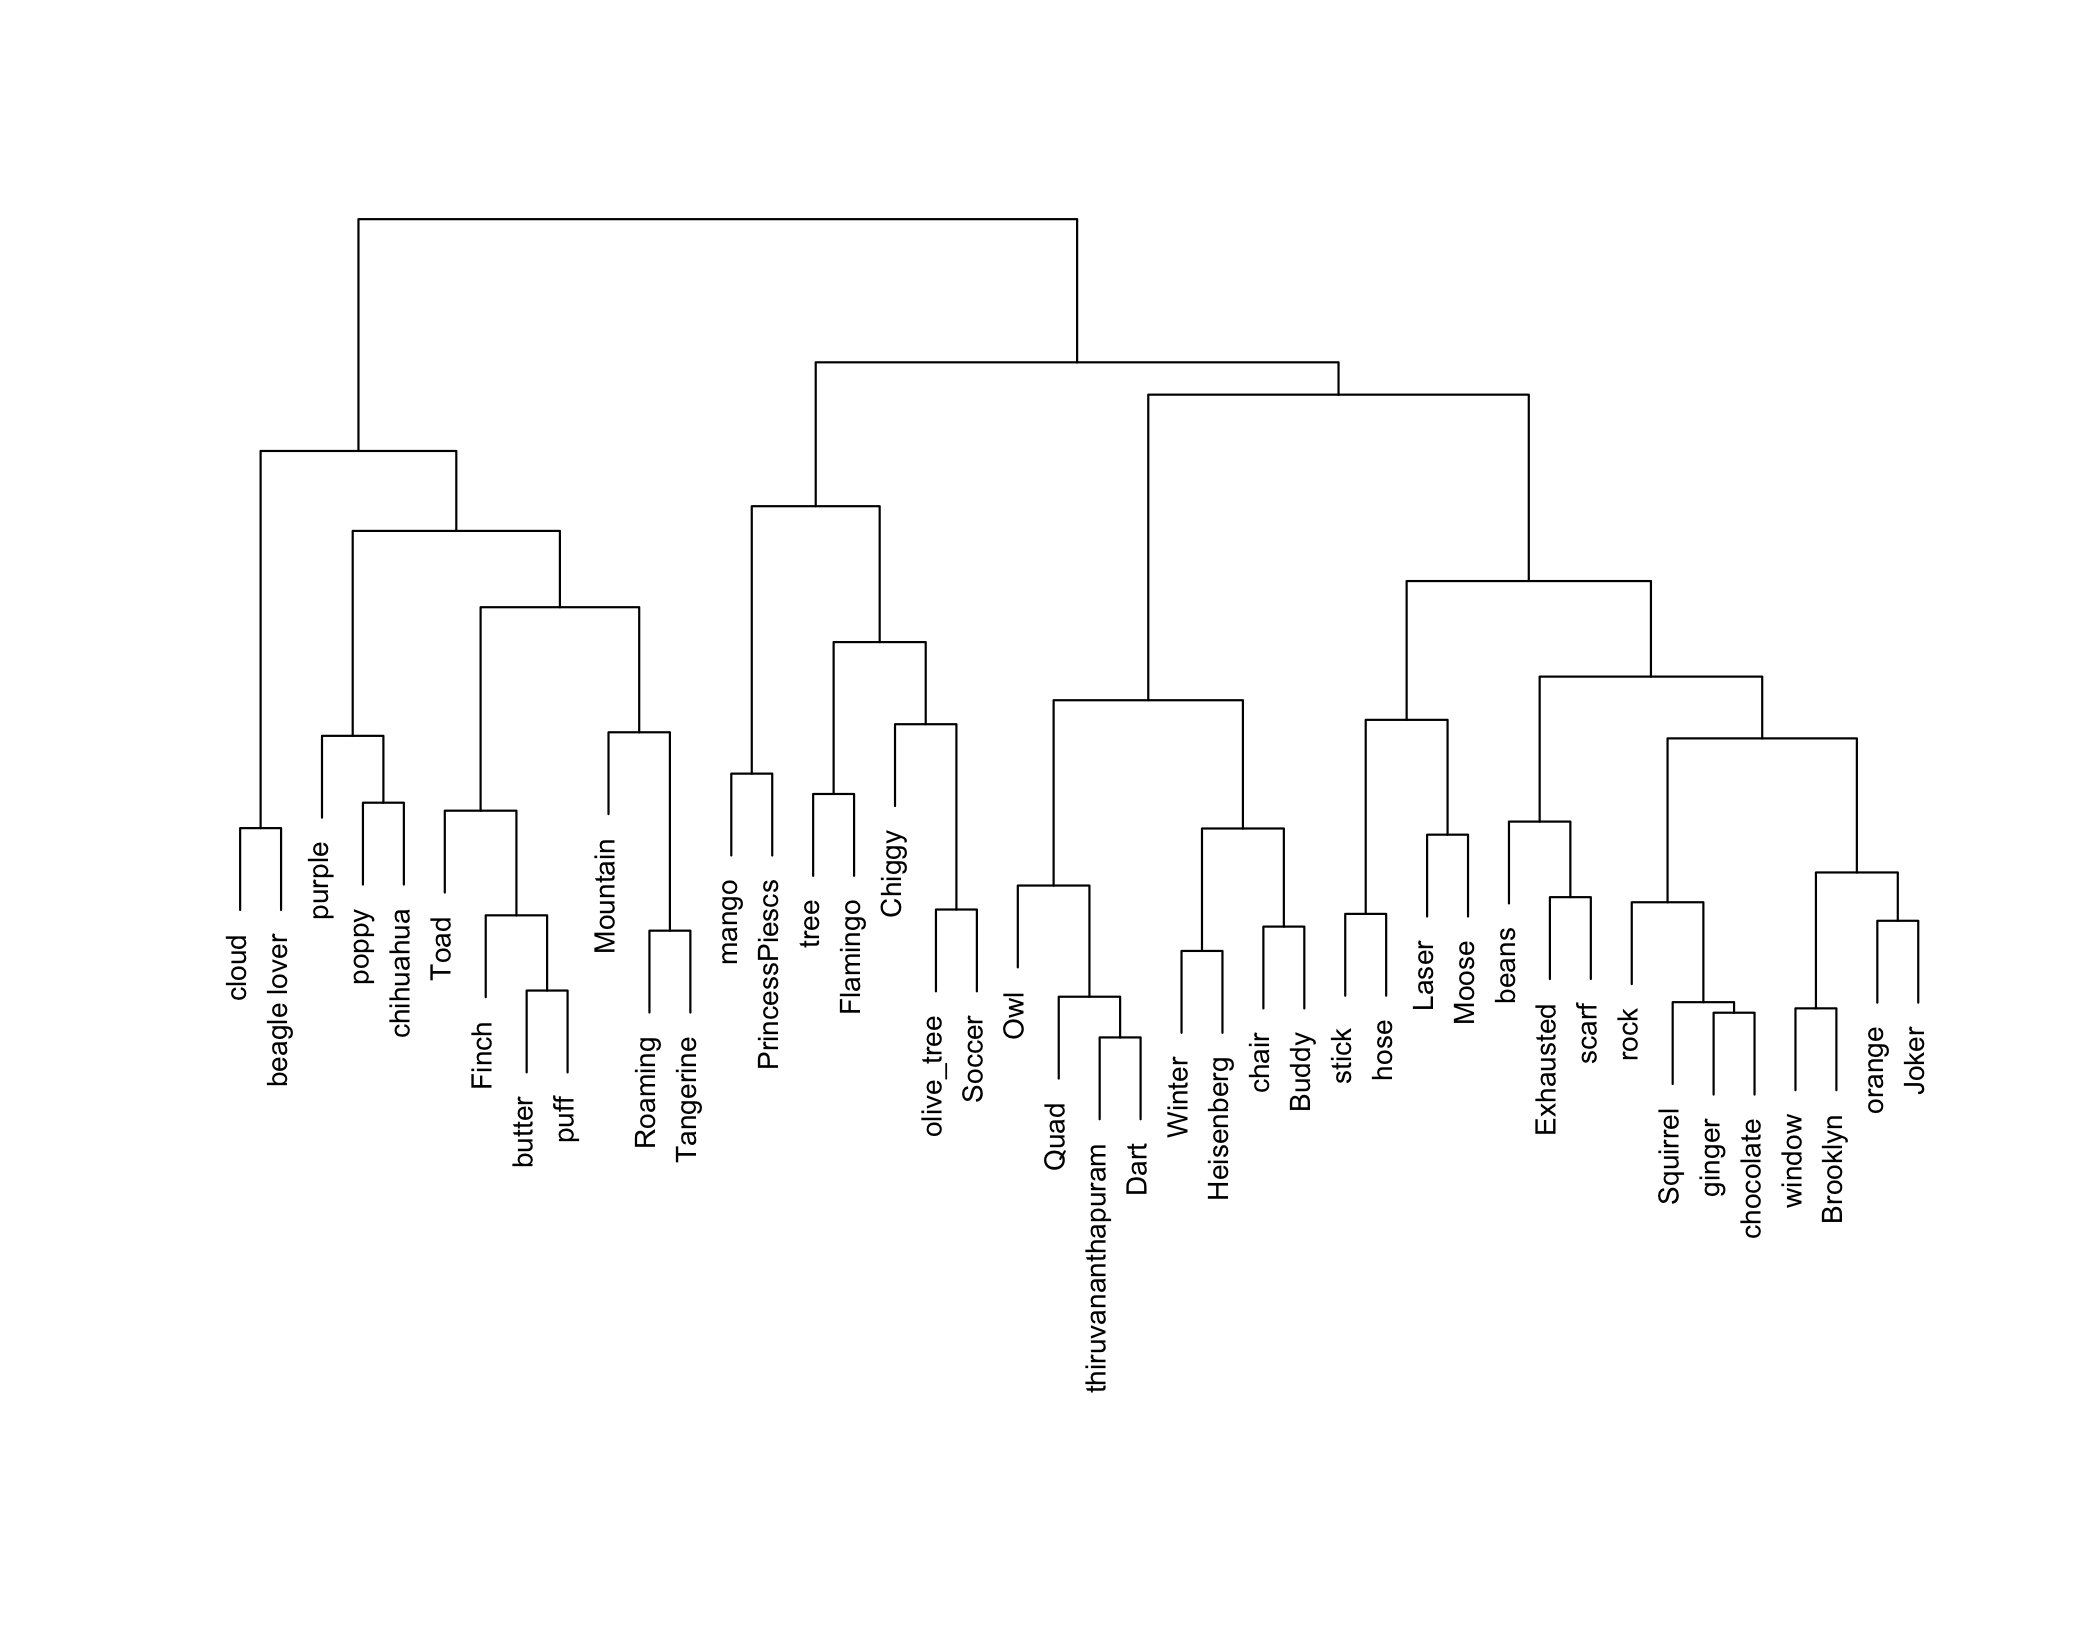
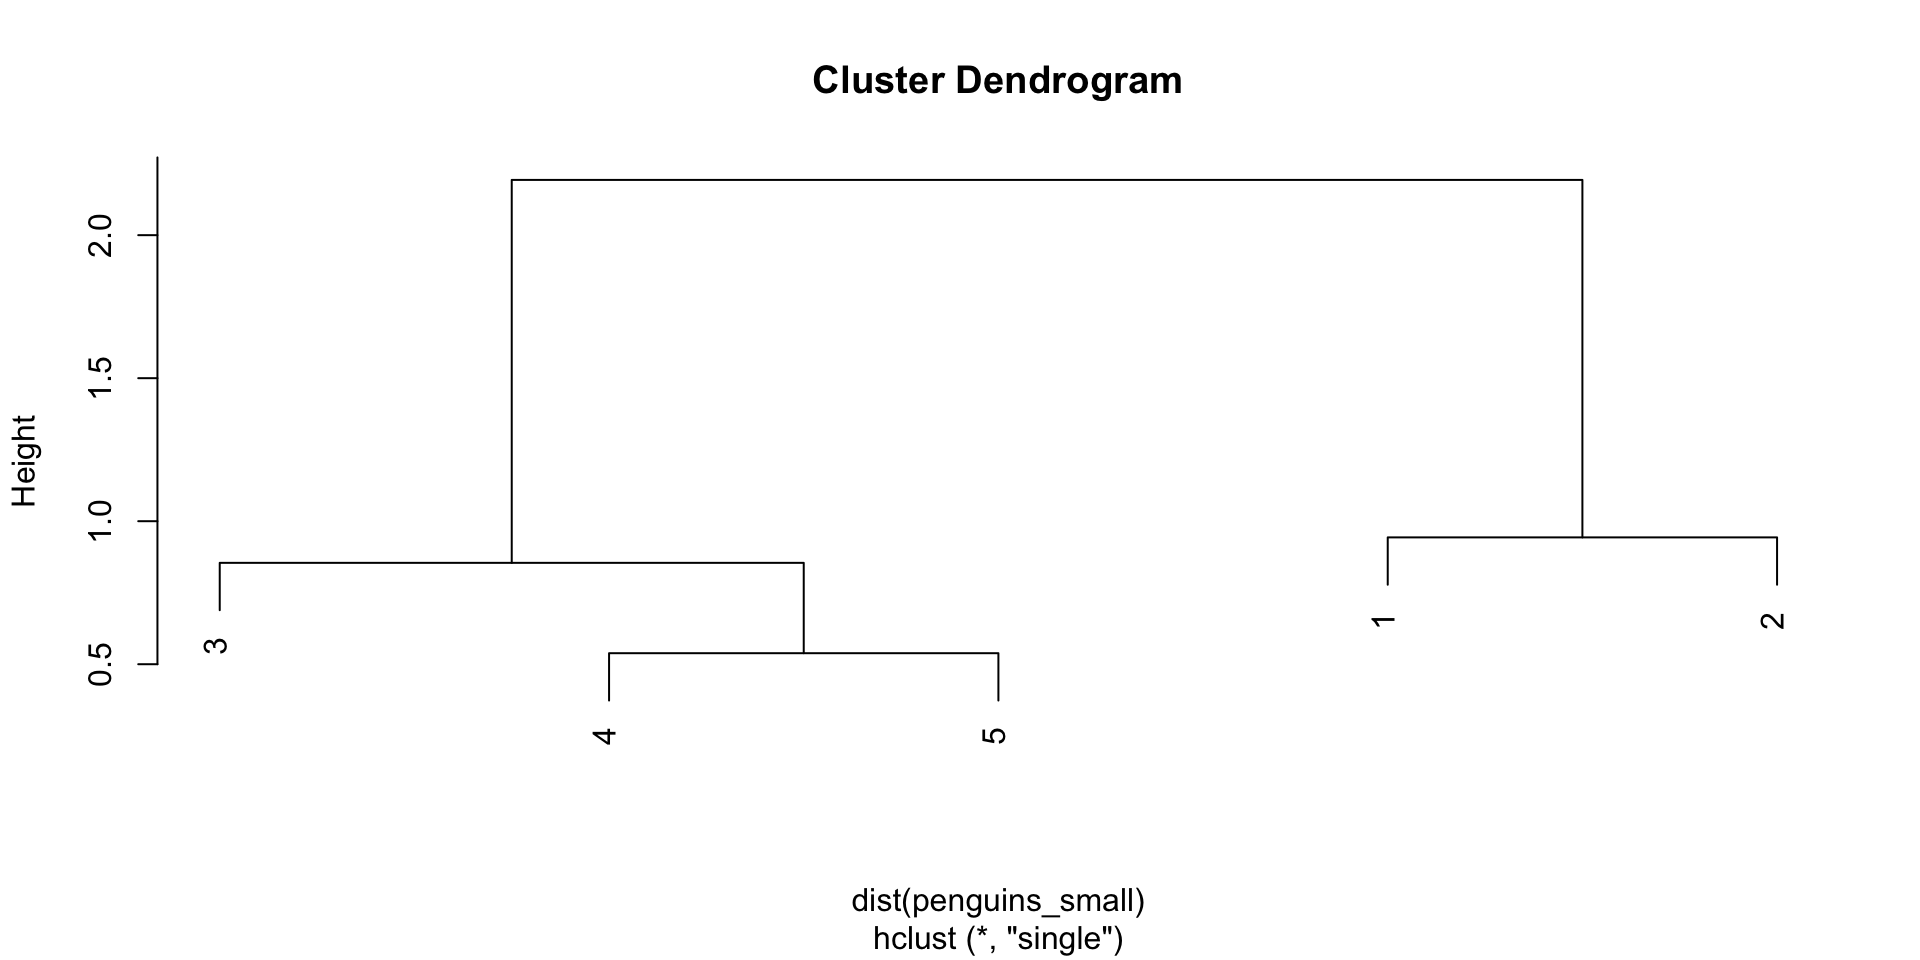
Dendrograms (of or relating to trees)
The hierarchical clustering algorithm produces a dendrogram. To use a dendrogram:
Start with the leaves at the bottom (unlike classification trees!). Each leaf represents a single case / row in our dataset.
Moving up the tree, fuse similar leaves into branches, fuse similar branches into bigger branches, fuse all branches into one big trunk (all cases).
The more similar two cases, the sooner their branches will fuse. The height of the first fusion between two cases’ branches measures the “distance” between them.
The horizontal distance between 2 leaves does not reflect distance!
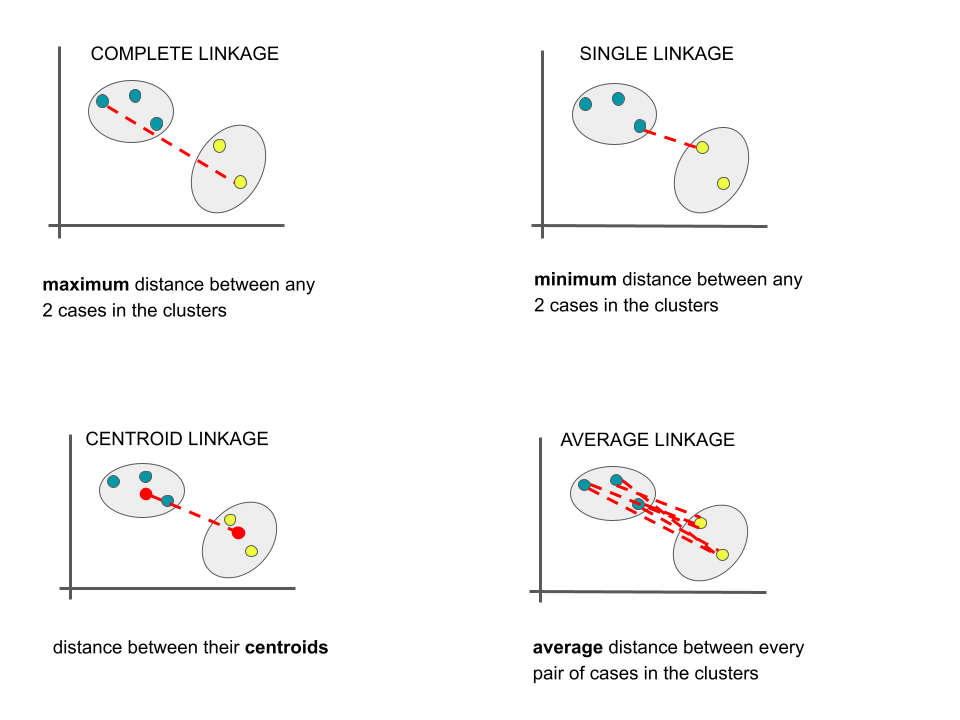
Measuring distance between 2 clusters
There are several linkages we can use to measure distance between 2 clusters / branches Unless specified otherwise, we’ll use the complete linkage method.
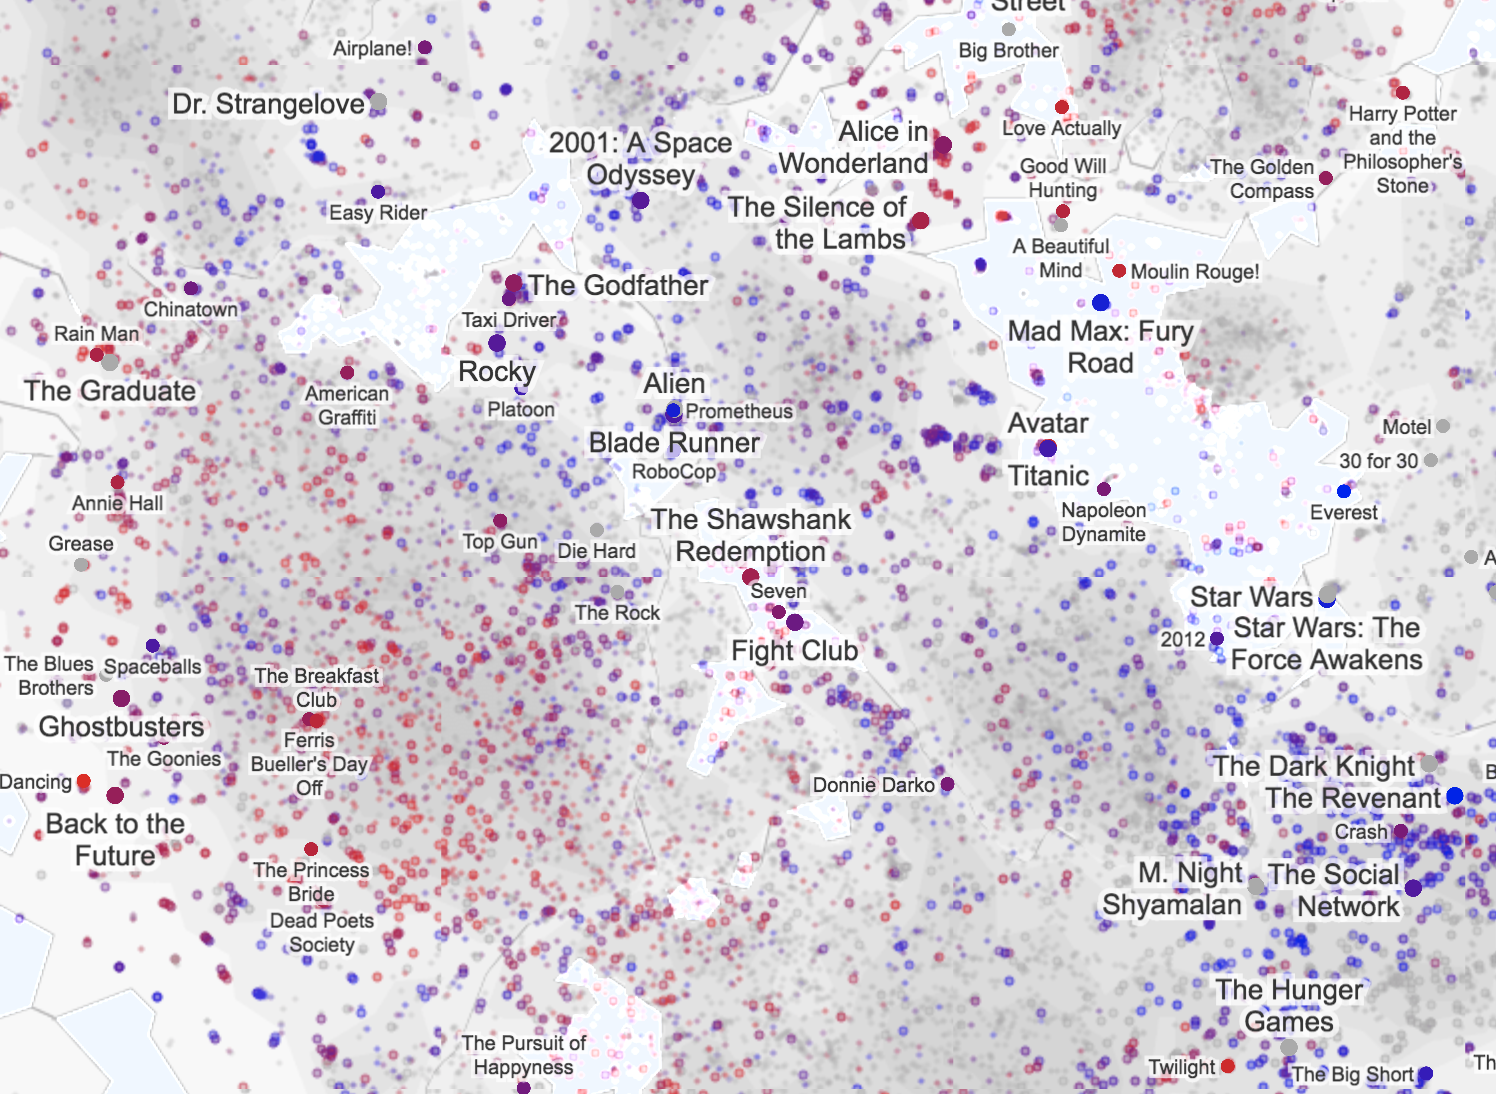
Example 1
Let’s start by using hierarchical clustering to identify similar groups (and possible species!) of penguins with respect to their bill lengths (mm), bill depths (mm), and body masses (g).
This algorithm relies on calculating the distances between each pair of penguins.
Why is it important to first standardize our 3 features to the same scale (centered around a mean of 0 with standard deviation 1)?
# A tibble: 6 × 3
  bill_length_mm bill_depth_mm body_mass_g
           <dbl>         <dbl>       <int>
1           39.1          18.7        3750
2           39.5          17.4        3800
3           40.3          18          3250
4           NA            NA            NA
5           36.7          19.3        3450
6           39.3          20.6        3650
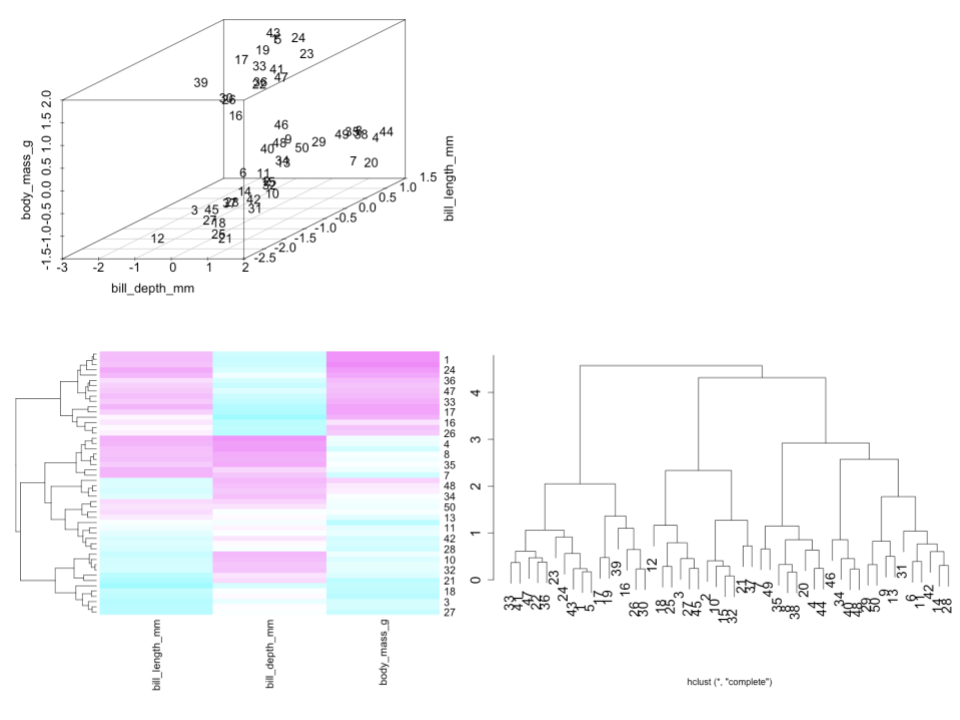
Example 2
Check out the standardized data, heat map, and dendrogram for a sample of just 50 penguins.
Is penguin 30 more similar to penguin 33 or 12?
Identify and interpret the distance, calculated using the complete linkage, between penguins 30 and 33.
Consider the far left penguin cluster on the dendrogram, starting with penguin 33 and ending with penguin 30. Use the heat map to describe what these penguins have in common.
Example 3
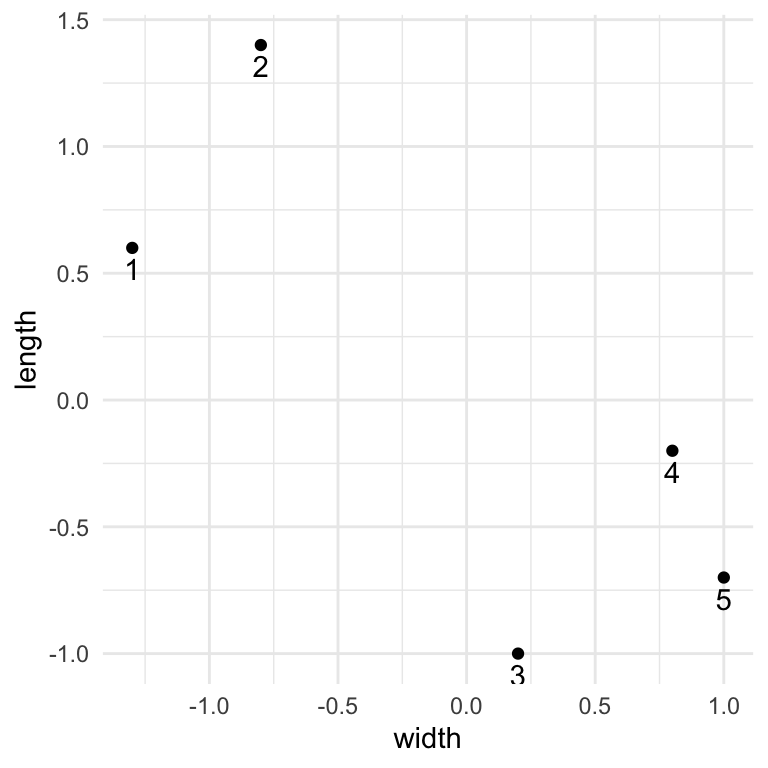
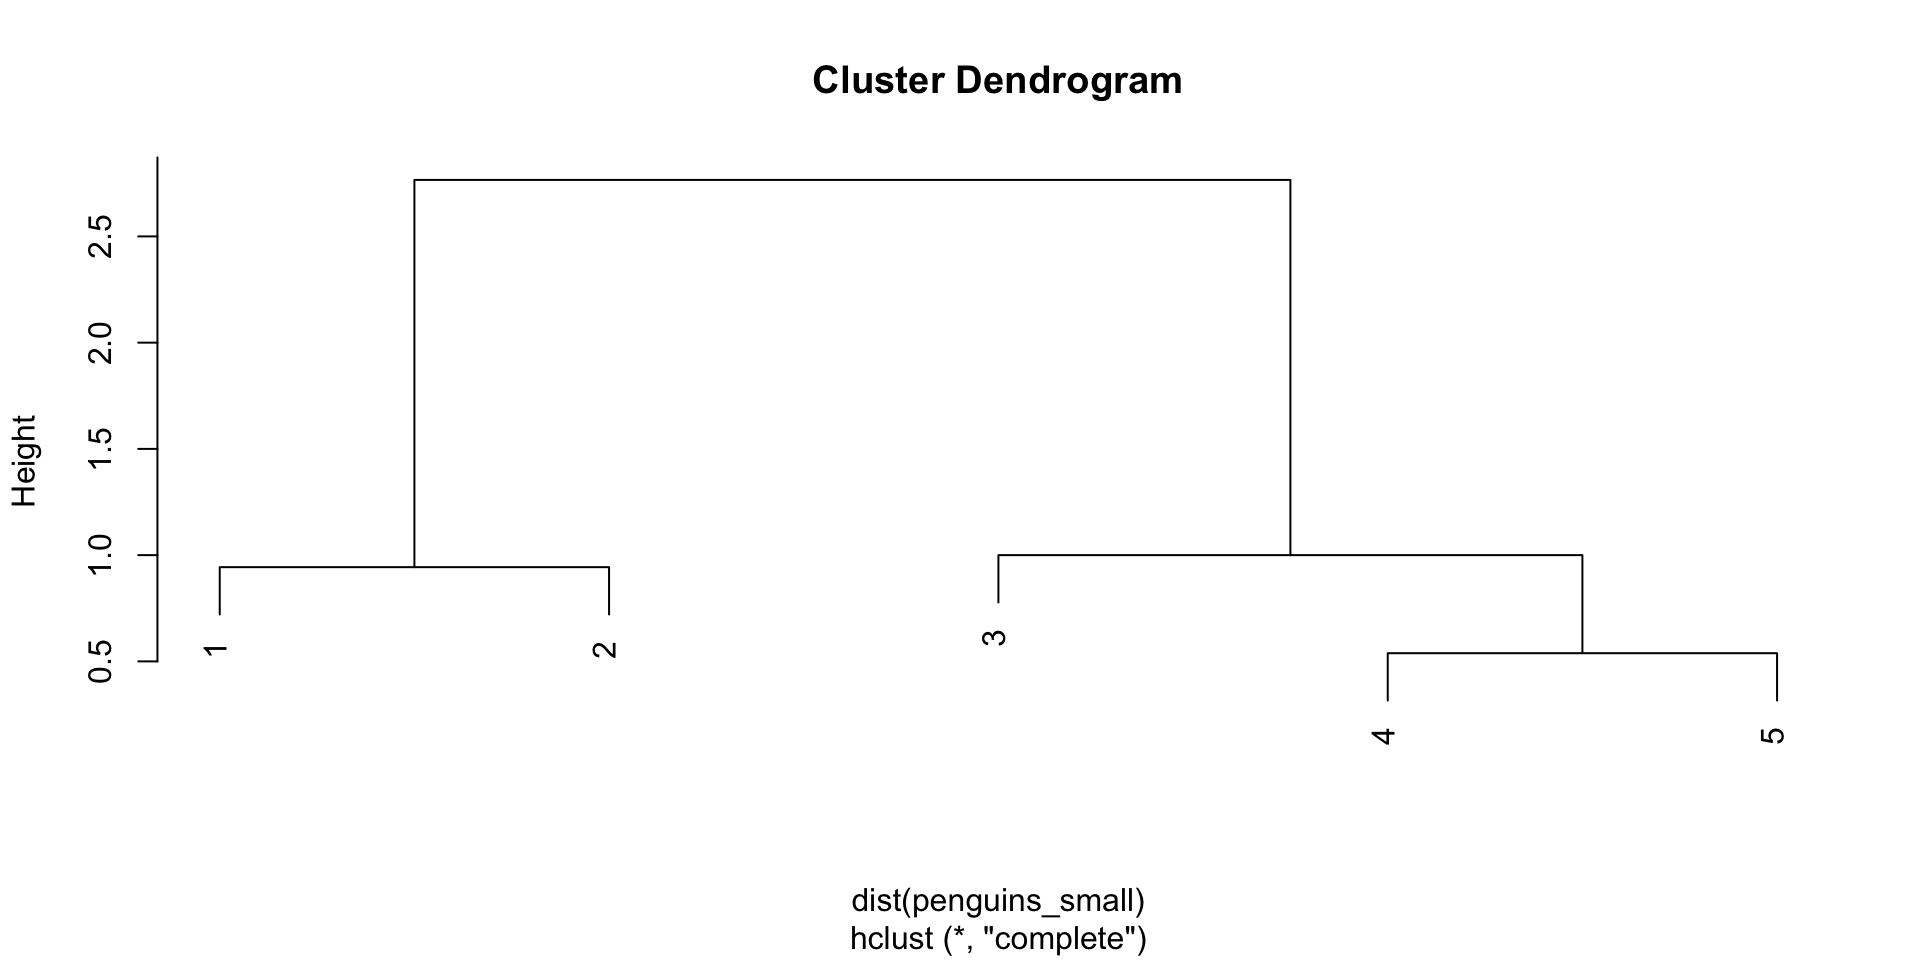
To really get the details, you’ll perform hierarchical clustering by hand for a small example.
Run the chunks to build a shiny app that we’ll use to build some intuition for hierarchical clustering.
Put the slider at 9 clusters. These 9 clusters are represented in the dendrogram and scatterplot of the data. Do you think that 9 clusters is too many, too few, or just right?
Now set the slider to 5. Simply take note of how the clusters appear in the data.
Now sloooooowly set the slider to 4, then 3, then 2. Each time, notice what happens to the clusters in the data plot. Describe what you observe.
What are your thoughts about the 2-cluster solution? What happened?!
Example 5
Is hierarchical clustering greedy?
We learned in the video that, though they both produce tree-like output, the hierarchical clustering and classification tree algorithms are not the same thing! Similarly, though they both calculate distances between each pair of data points, the hierarchical clustering and KNN algorithms are not the same thing! Explain.
Small Group Work
For the rest of the class, work together on Ex 1-3 on HW7 (Rmd on Moodle).