K-means Clustering
Context
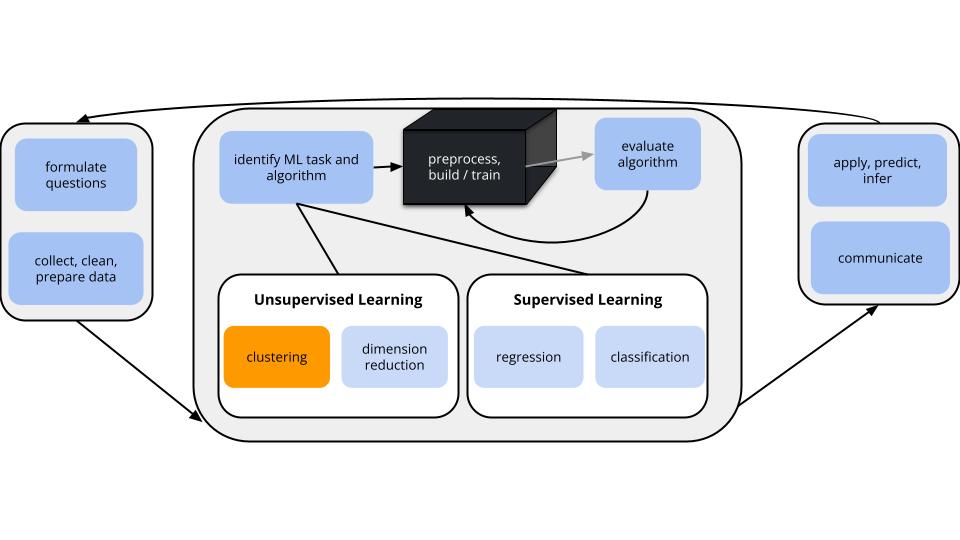
GOALS
Suppose we have a set of feature variables (\(x_1,x_2,...,x_p\)) but NO outcome variable y. Thus instead of our goal being to predict/classify/explain y, we might simply want to…
- Examine the structure of our data.
- Utilize this examination as a jumping off point for further analysis.
Example 1
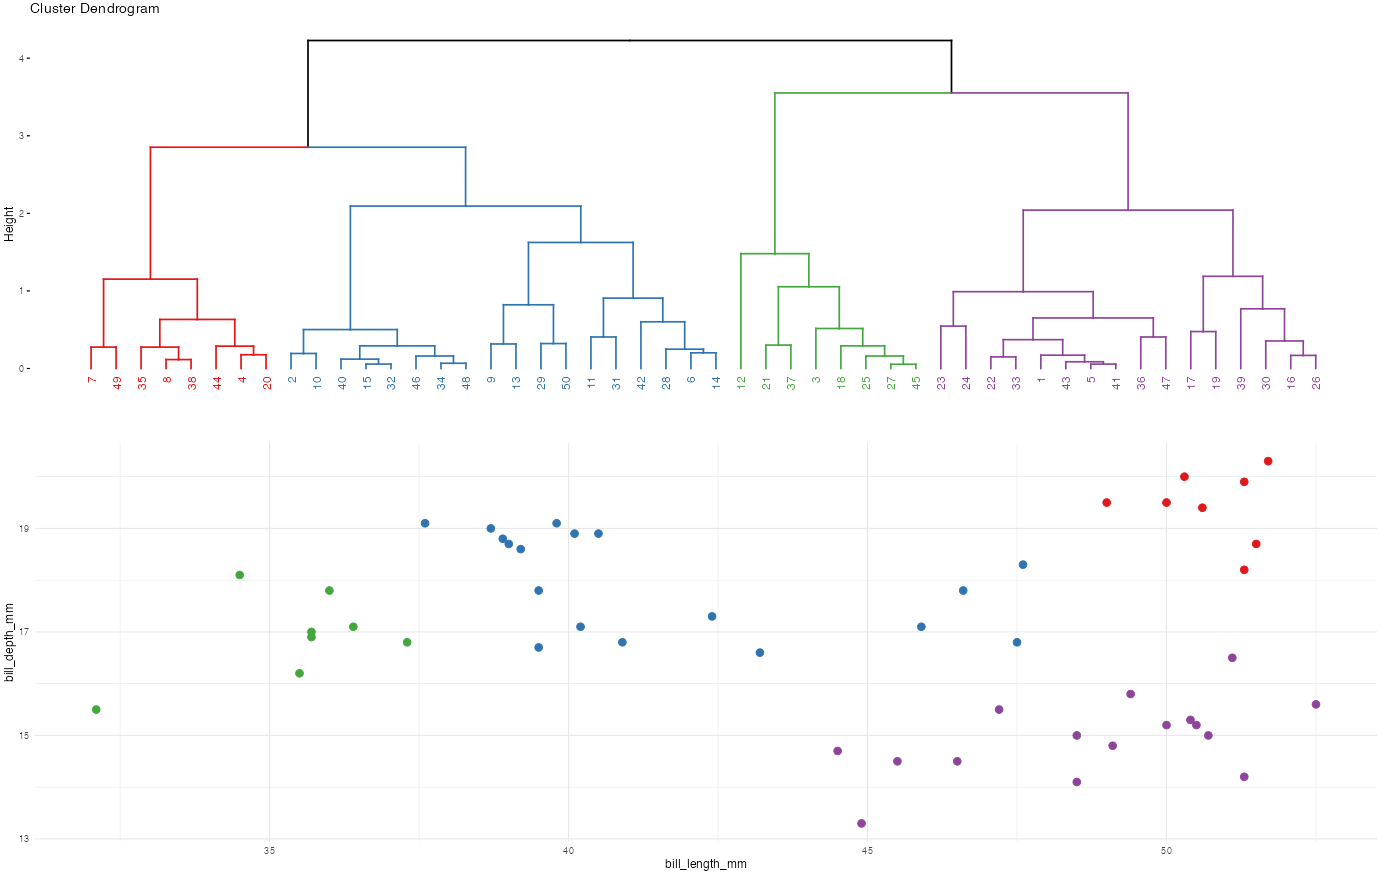
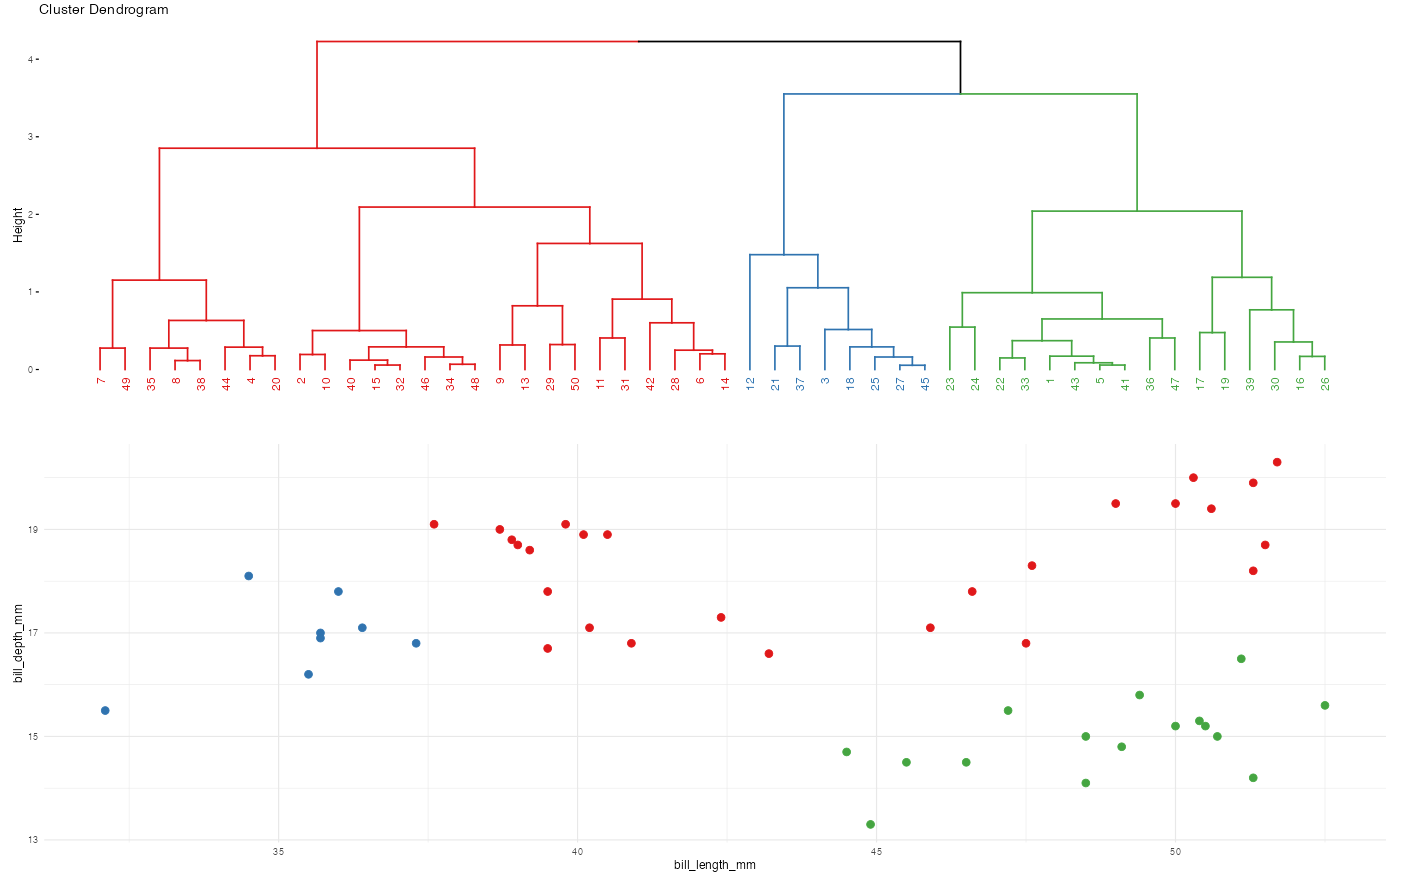
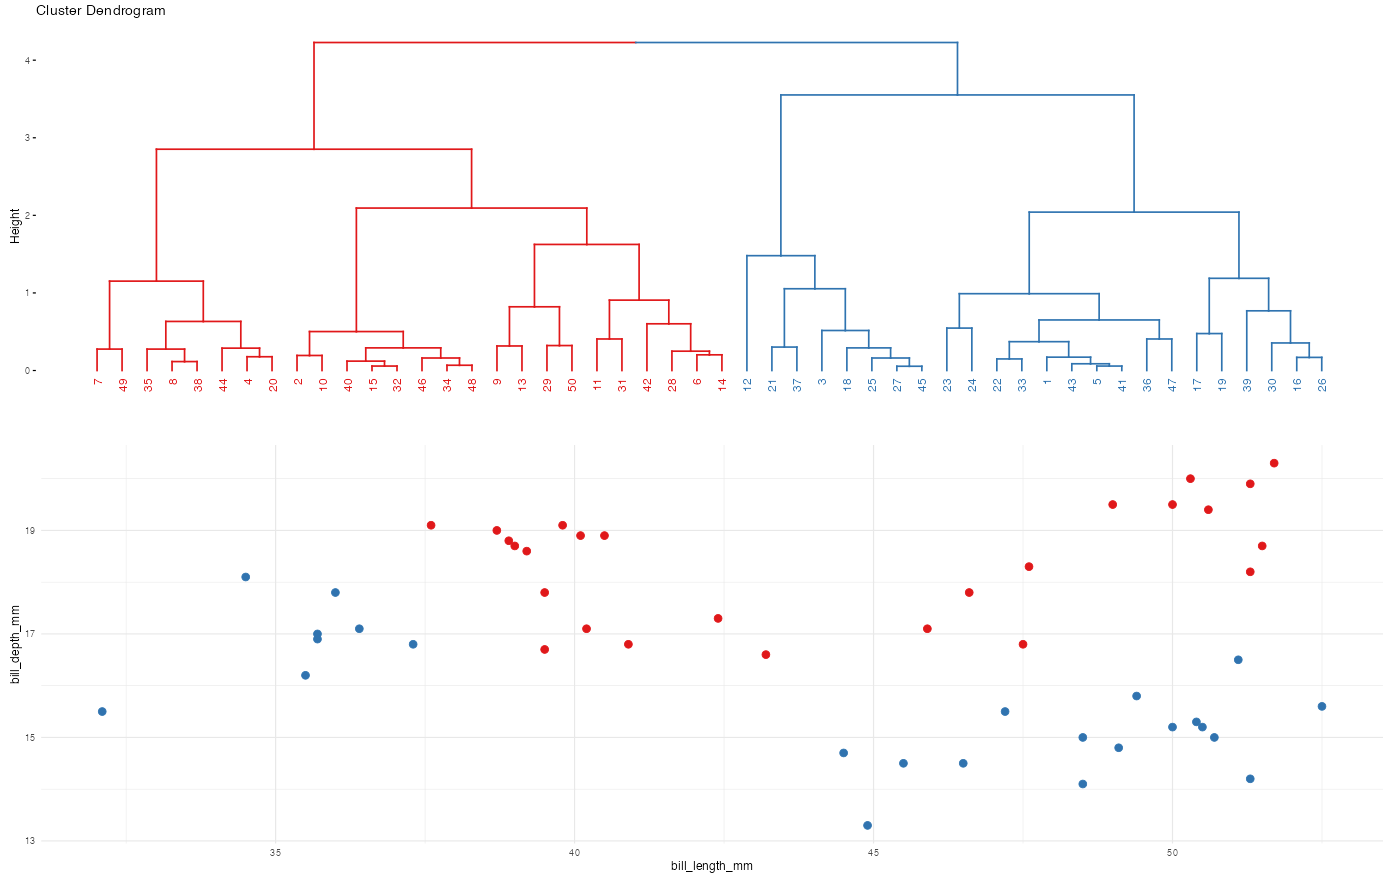
Recall the hierarchical algorithm.
- Each data point starts as a leaf.
- Compute the Euclidean distance between all pairs of data points with respect to their features x.
- Fuse the 2 closest data points into a single cluster or branch.
- Continue to fuse the 2 closest clusters until all cases are in 1 cluster.
Revisit screenshots from the shiny app to explore the results of this algorithm.
Why can the “greediness” of this algorithm sometimes produce strange results?
Example 3
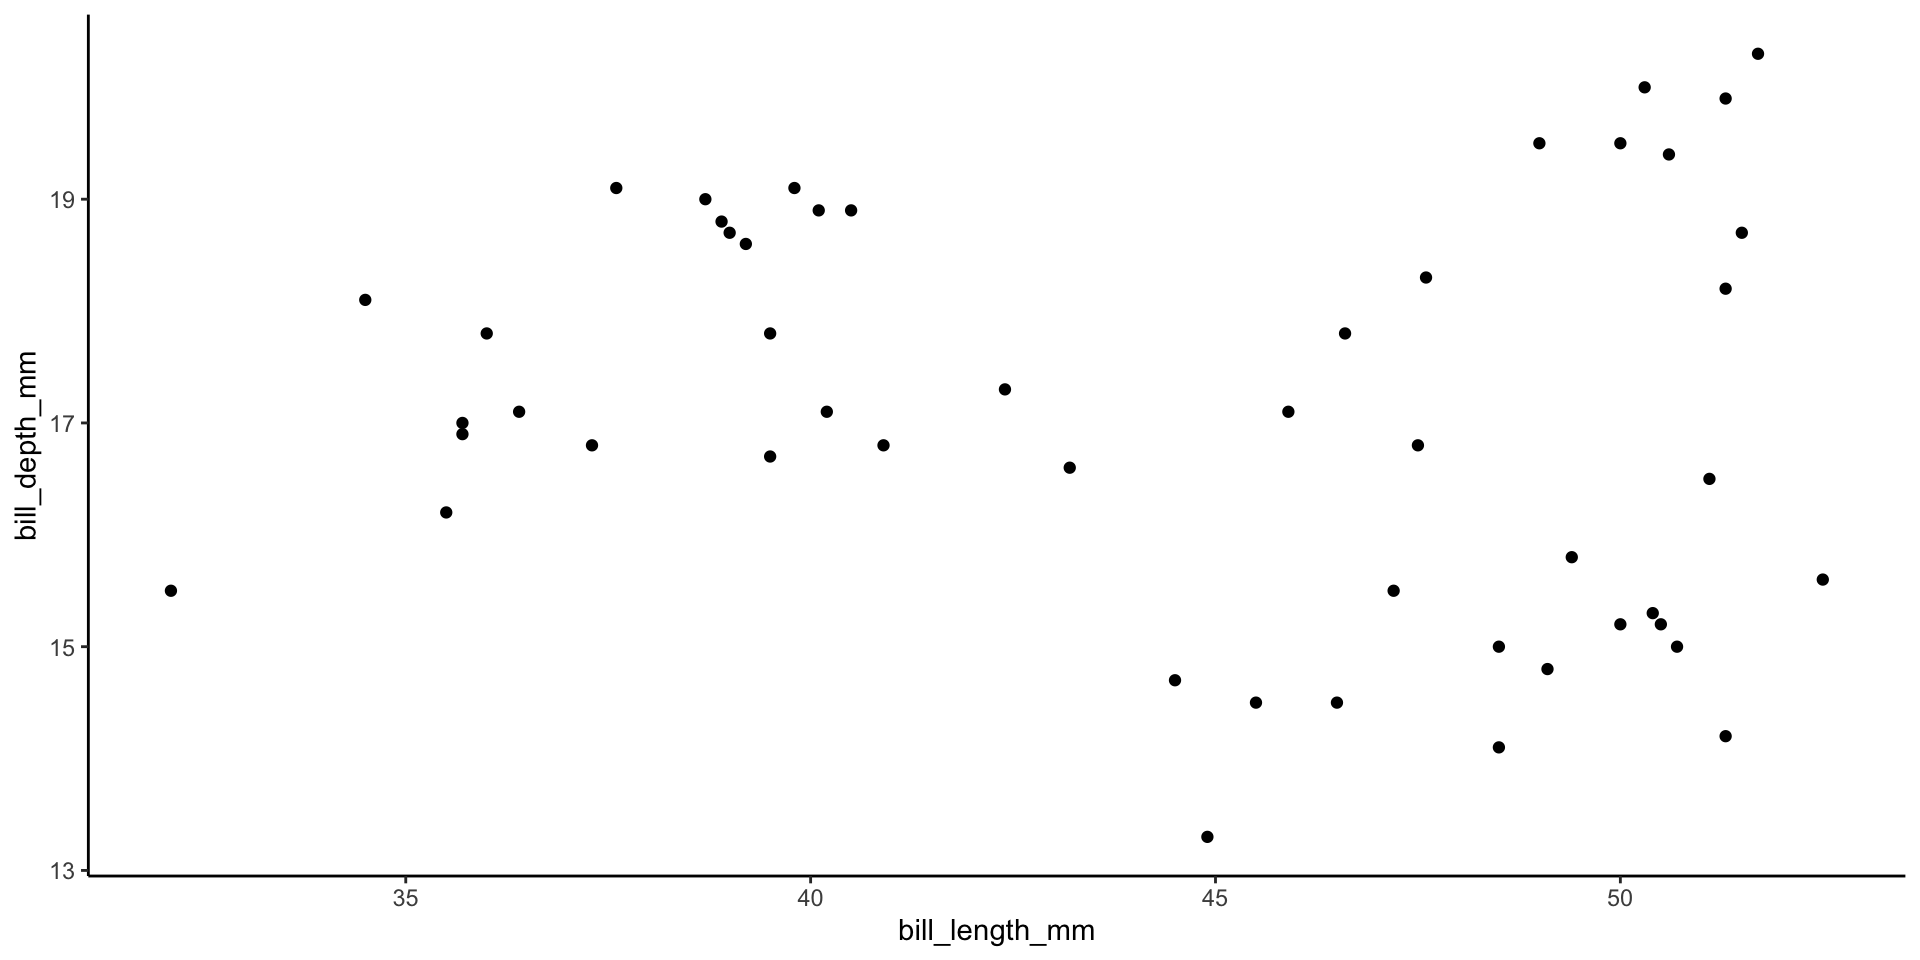
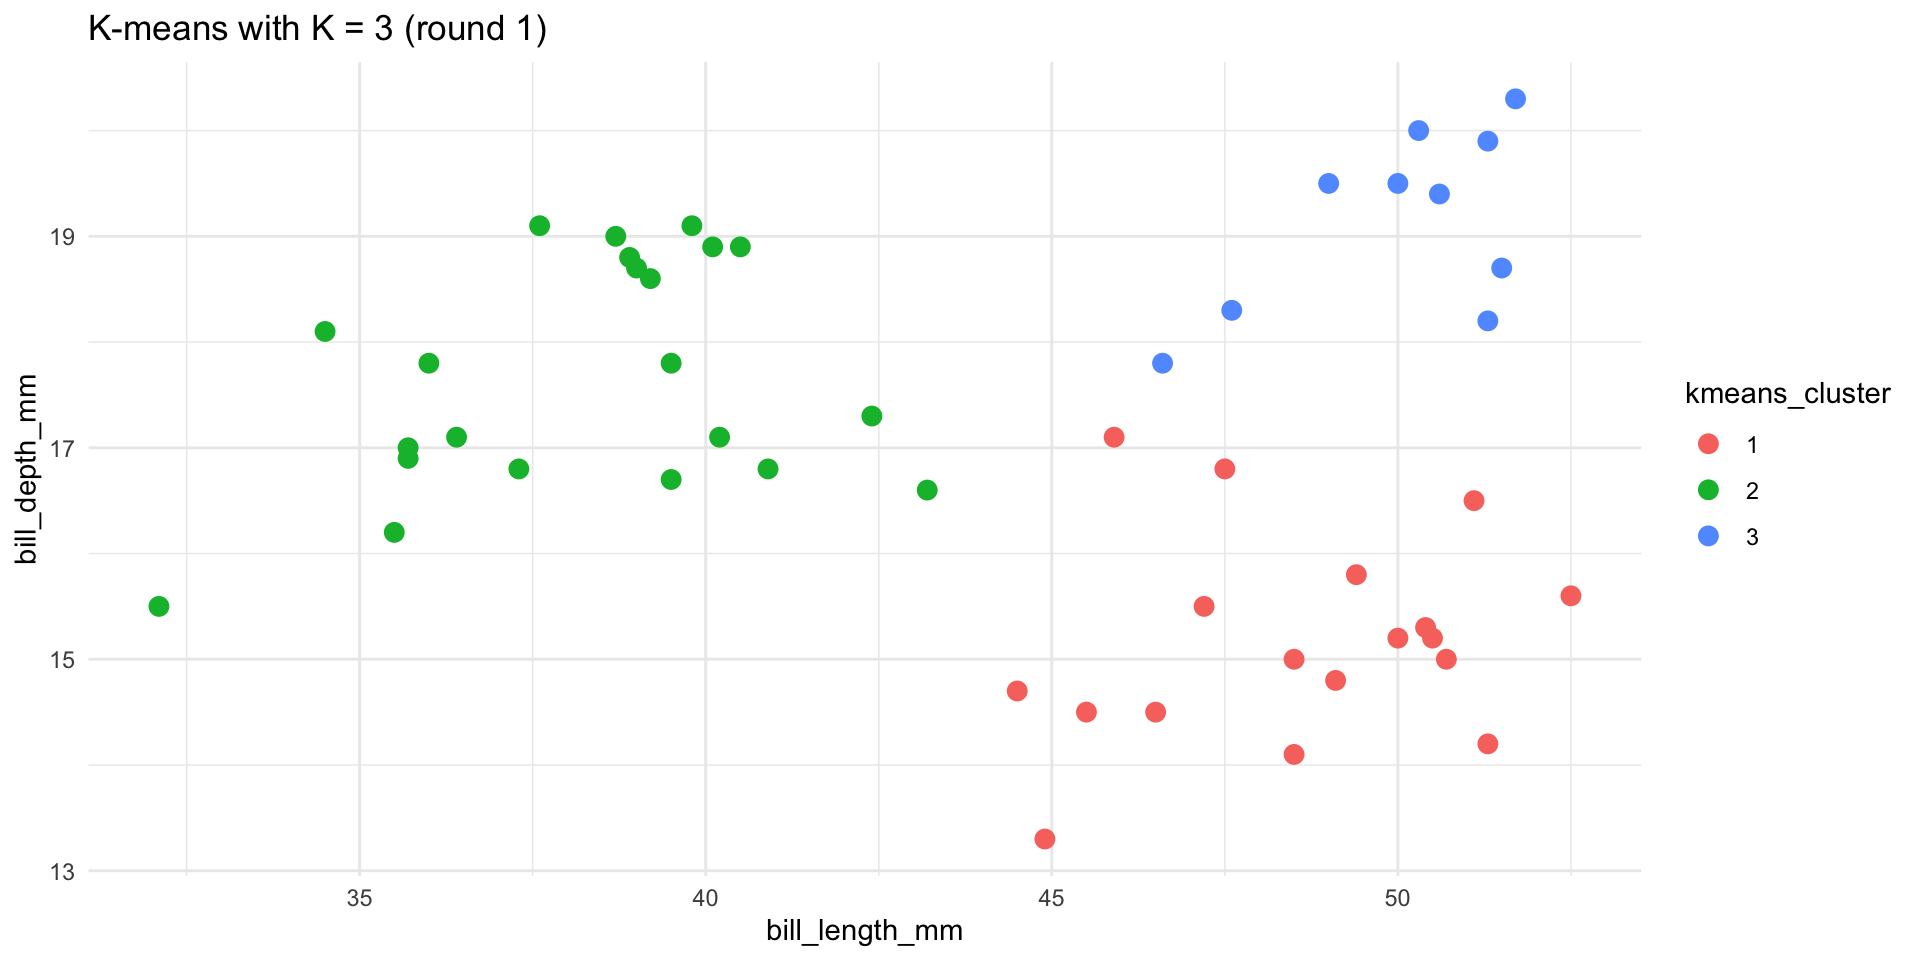
Let’s do K-means clustering in R using our penguin data:
We’ll cluster these penguins based on their bill lengths and depths:
- Run the K-means algorithm using K = 3. We didn’t set the seed for hierarchical clustering. Why do we have to set the seed for K-means? Why do we have to scale the data?
- Let’s repeat the K-means algorithm with K = 3. BUT let’s use a different seed. How did the results change and why is this possible?
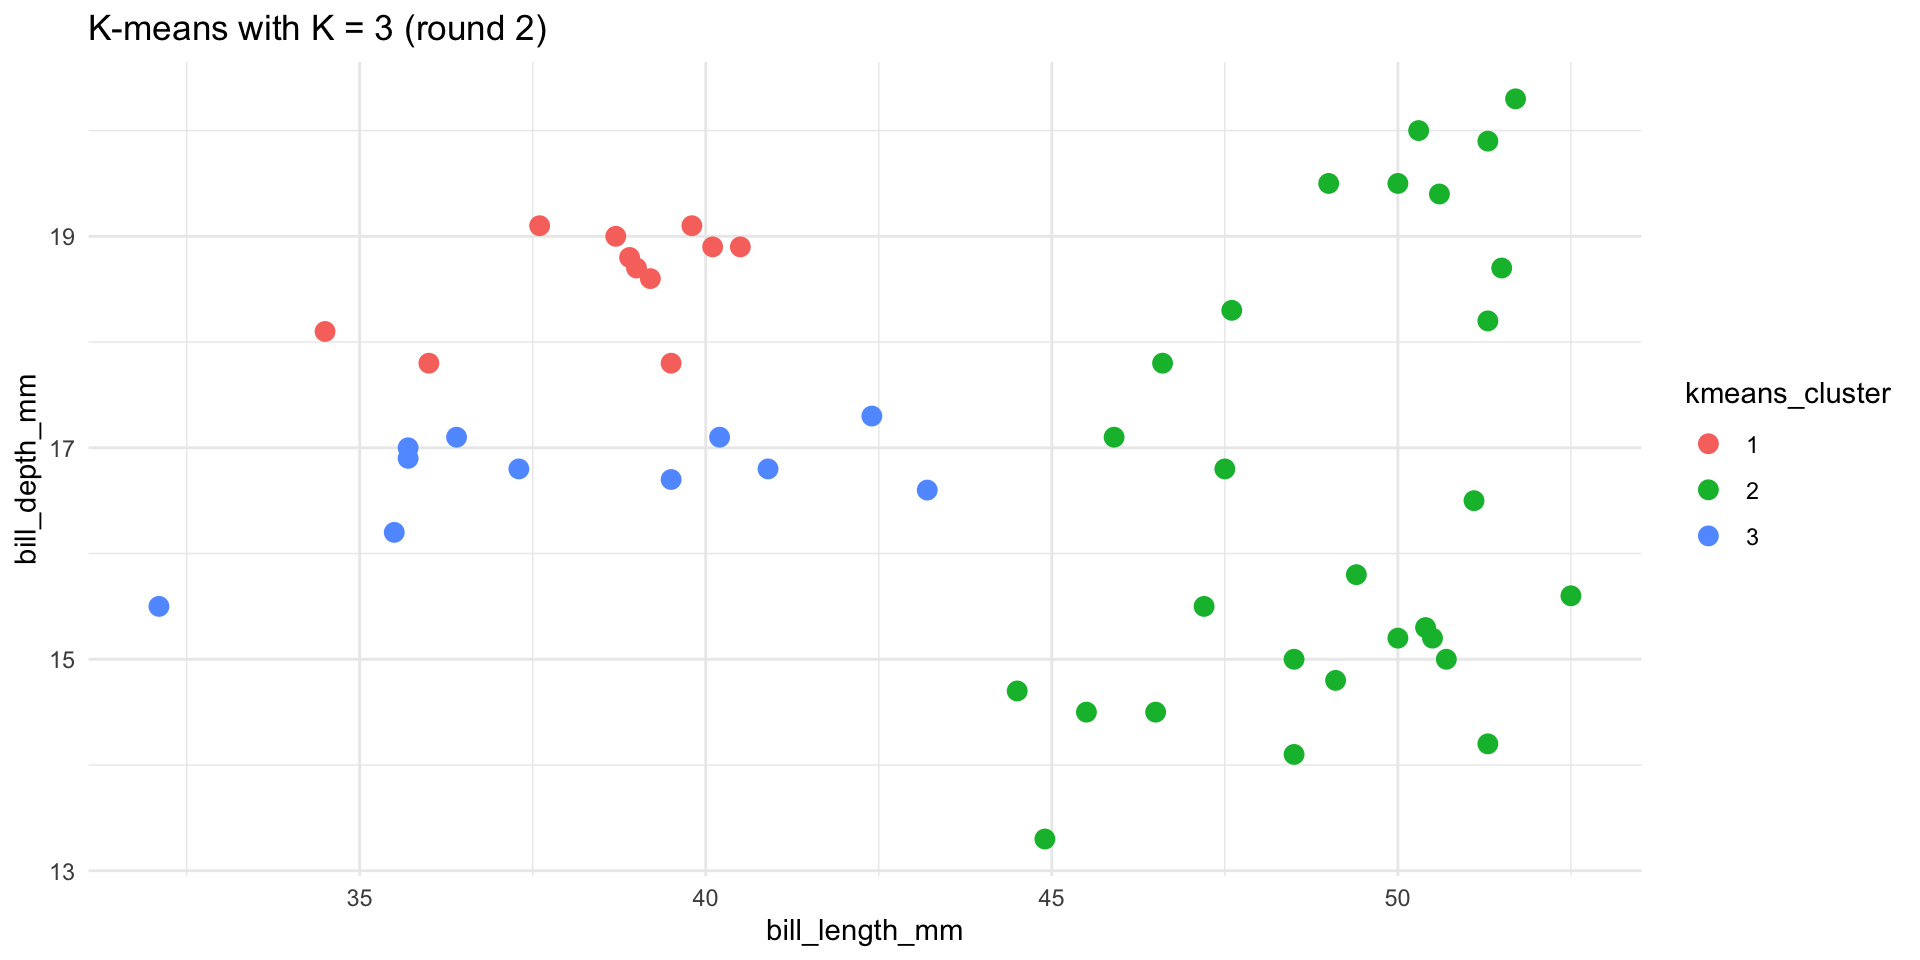
- In practice, we should try out a variety of seeds?
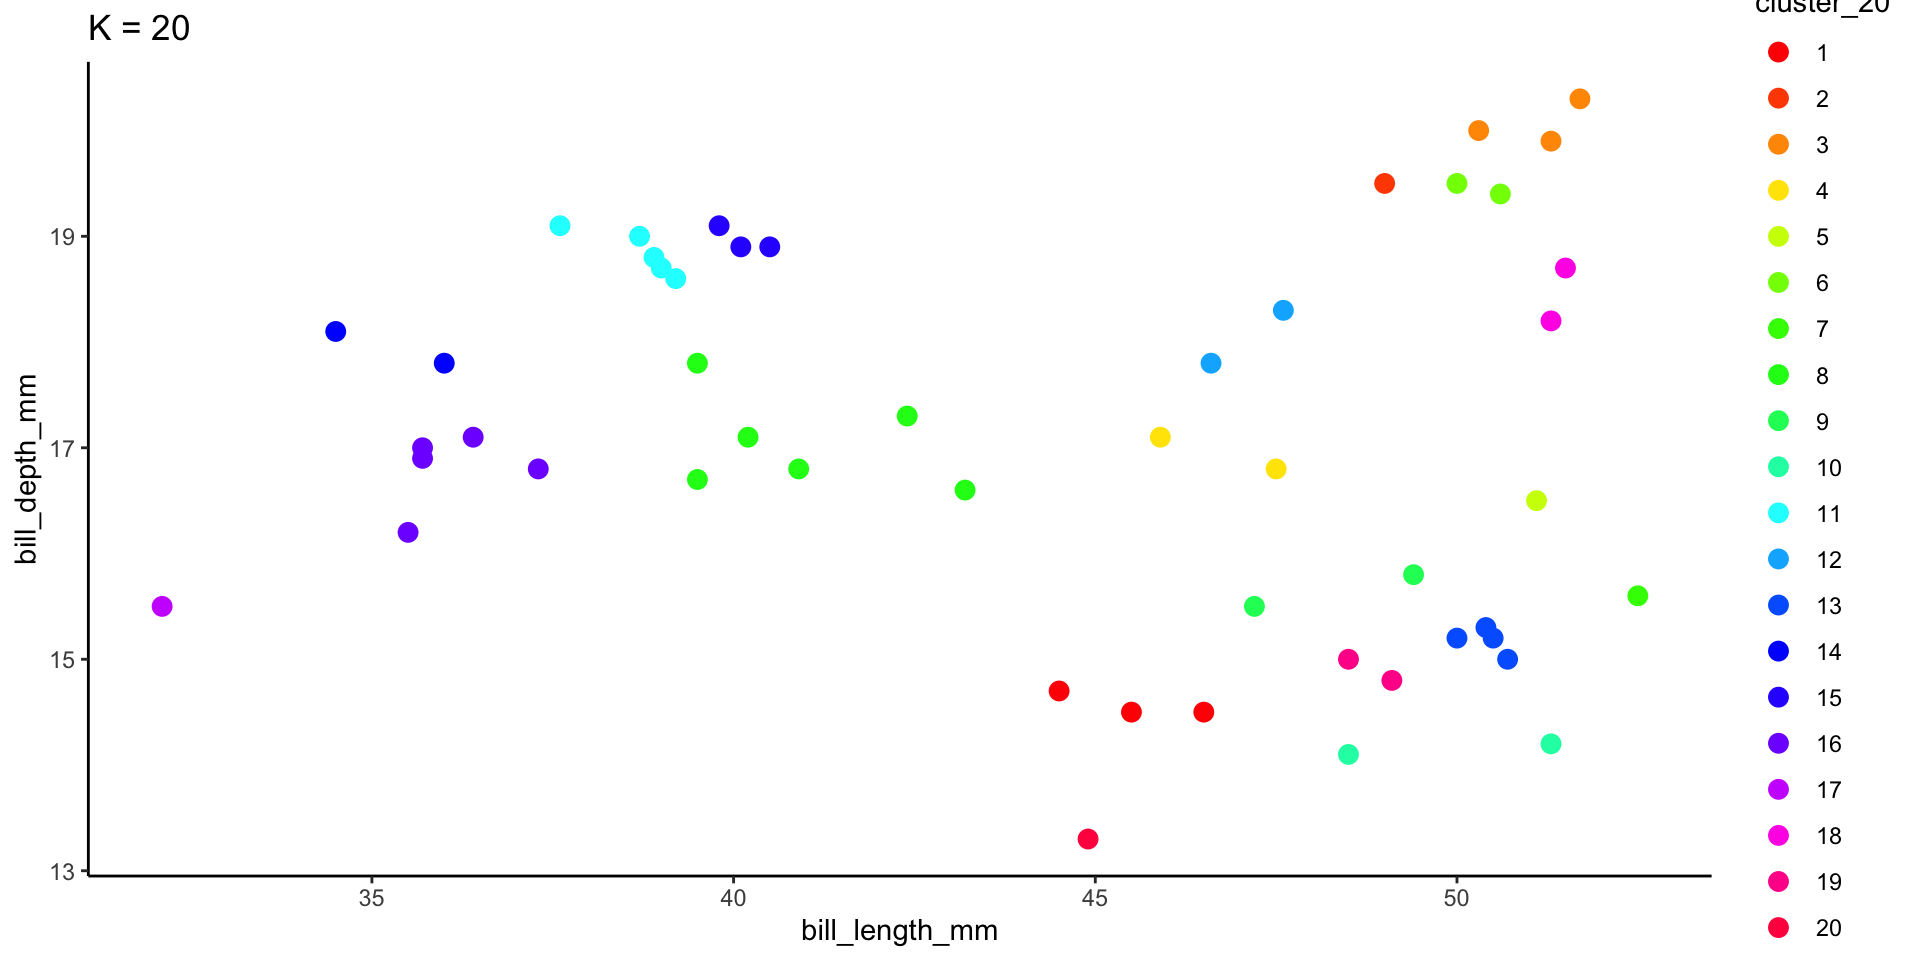
Example 4
To implement K-means clustering we must choose an appropriate K! Use the following example to discuss the goldilocks challenge of picking K.
Example 5
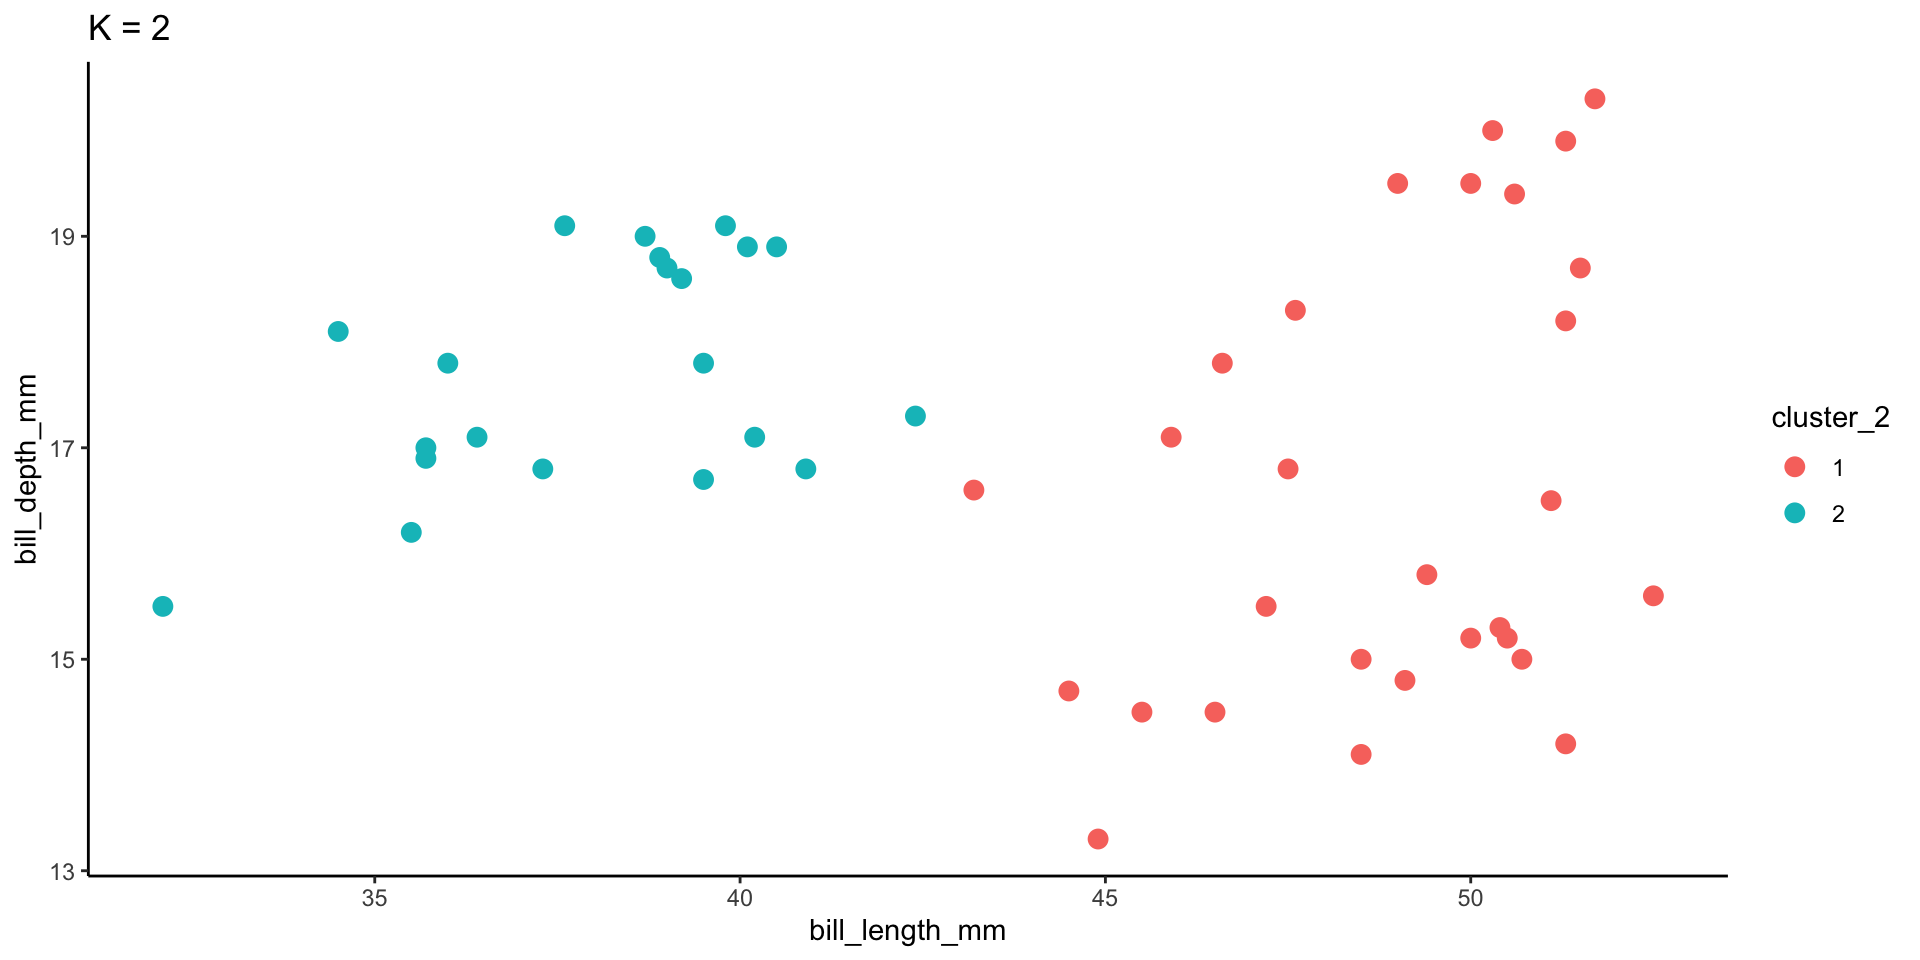
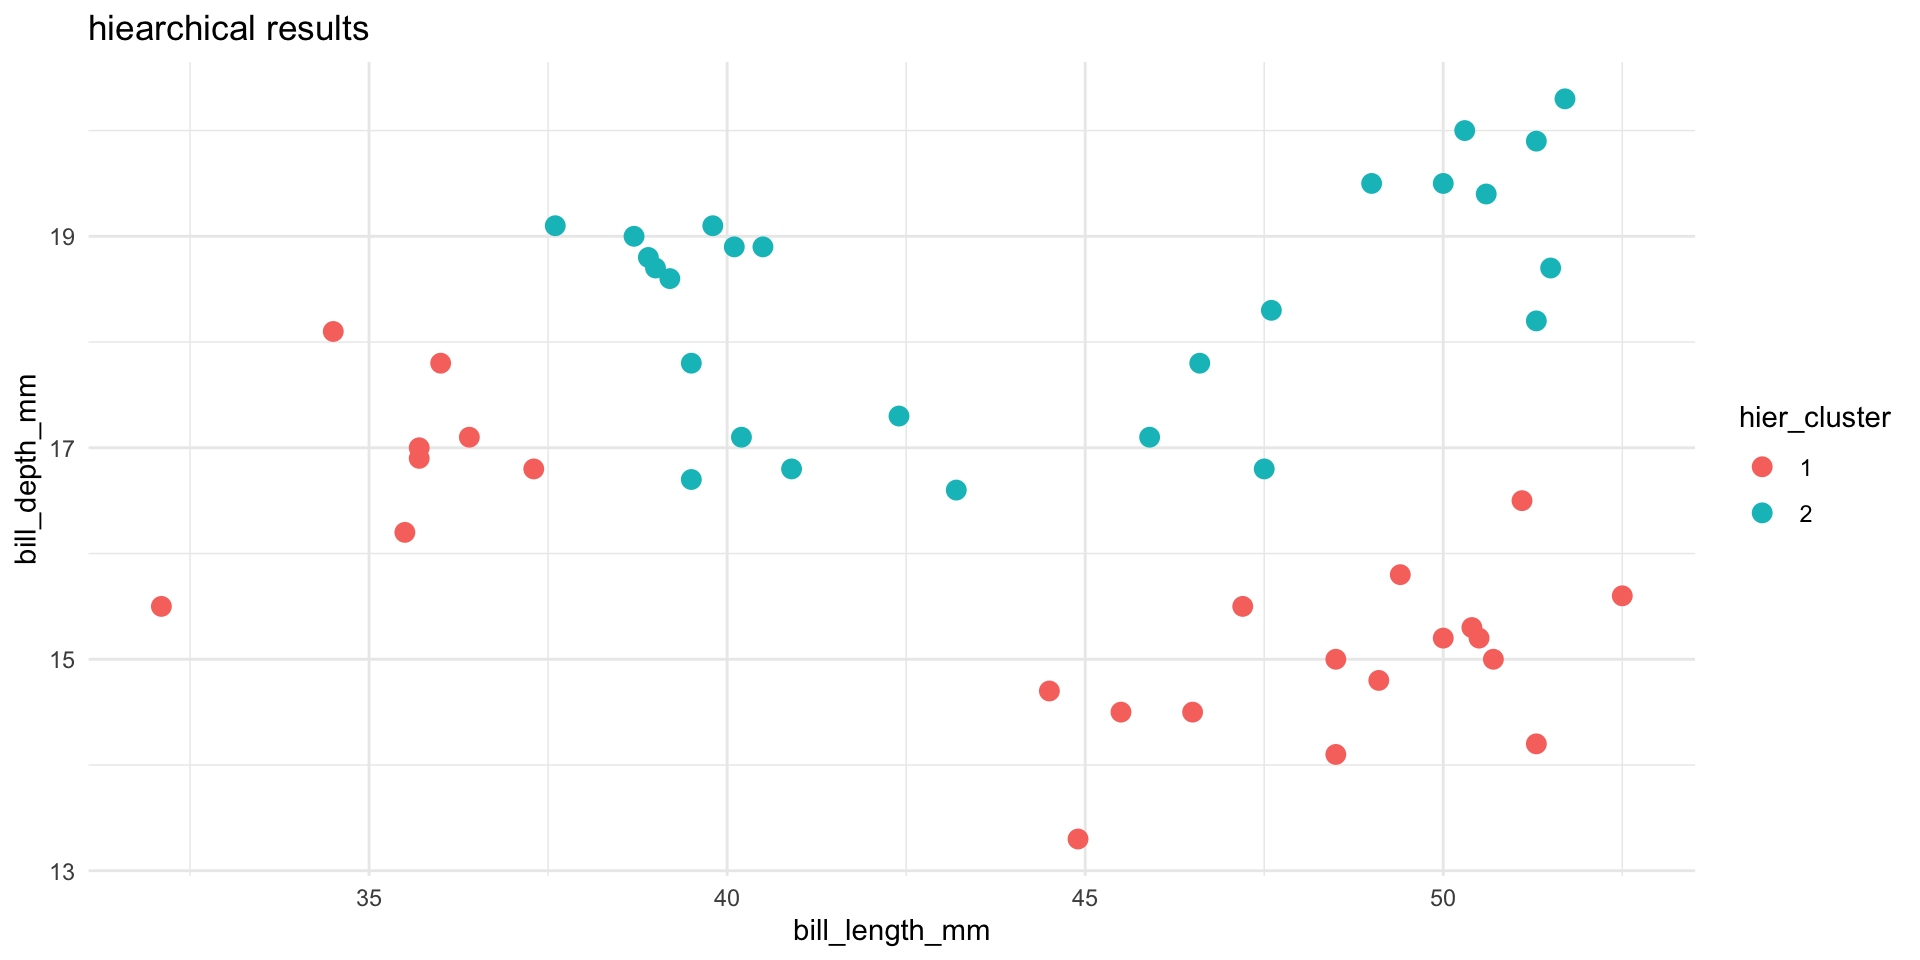
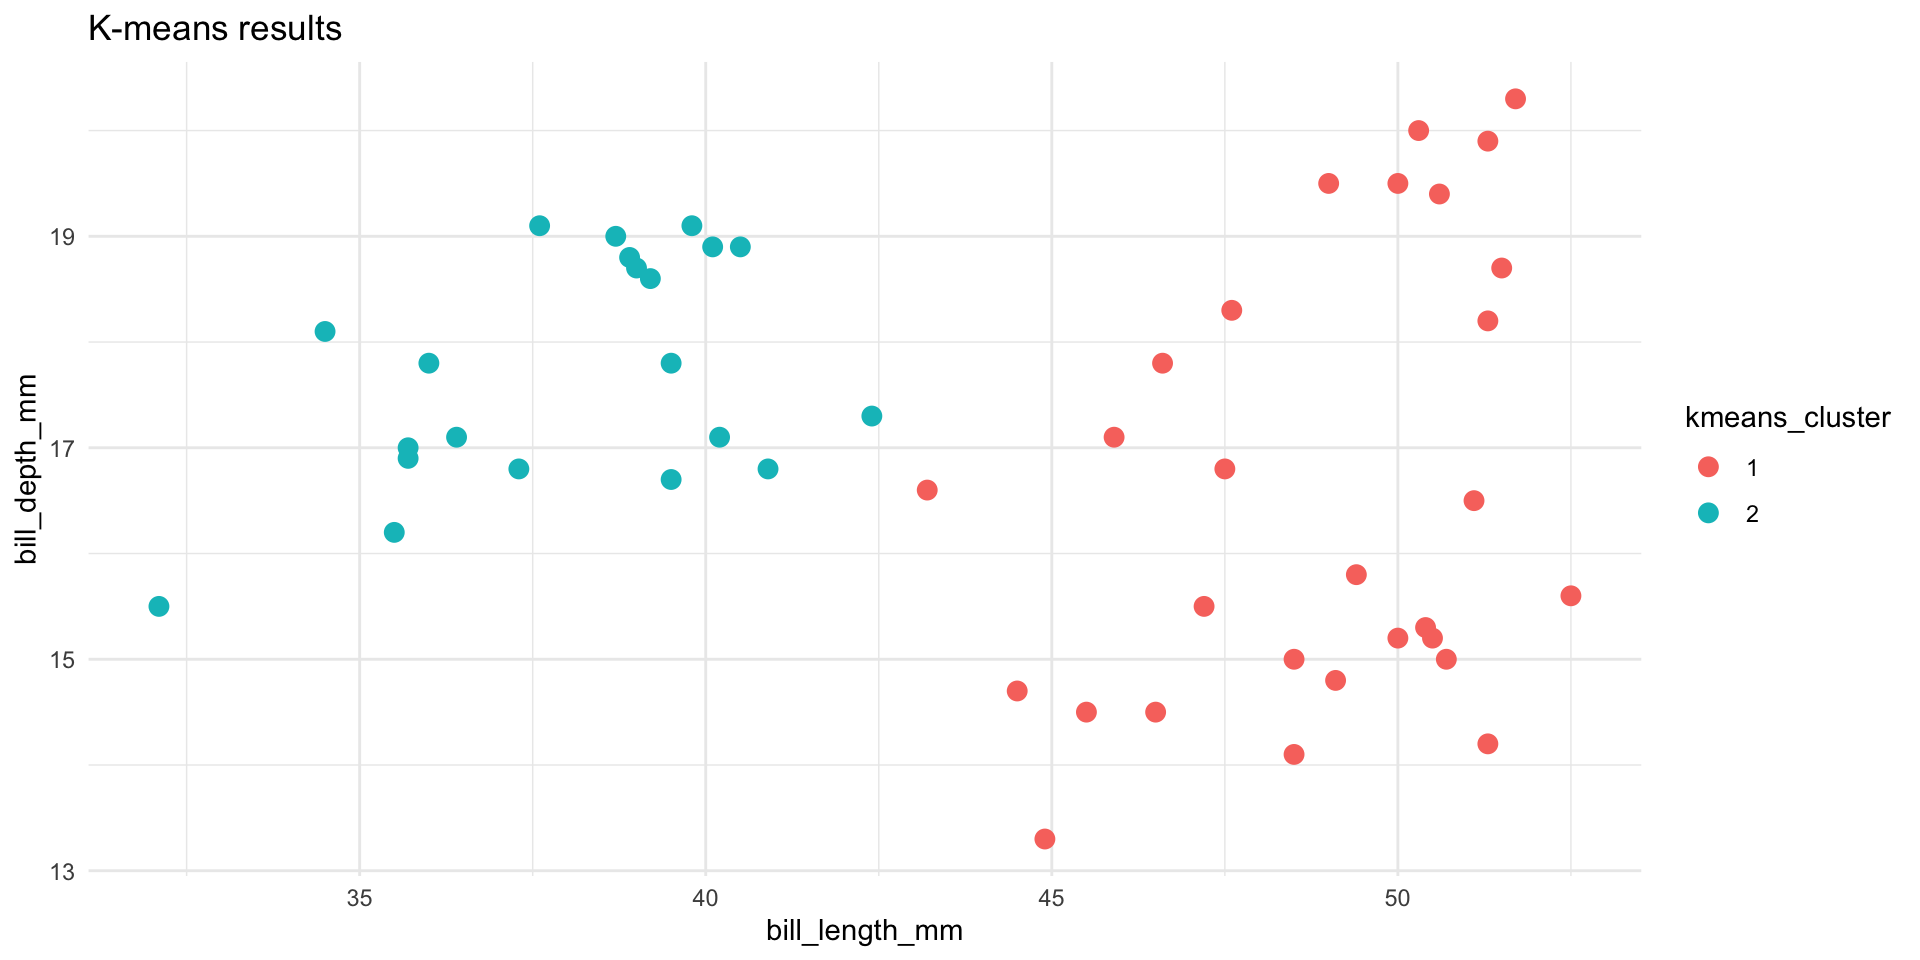
Let’s compare and contrast the results of the hierarchical and K-means algorithms. To this end, let’s use both to identify 2 penguin clusters:
- Do the clusters defined by the two algorithms agree? NOTE: the actual cluster numbers are arbitrary.
# A tibble: 6 × 4
  bill_length_mm bill_depth_mm hier_cluster kmeans_cluster
           <dbl>         <dbl> <fct>        <fct>
1           50.7          15   1            1
2           37.6          19.1 2            2
3           35.5          16.2 1            2
4           51.3          19.9 2            1
5           50.4          15.3 1            1
6 40.9 16.8 2 2 - Plot the cluster assignments. Which algorithm produces seemingly better clusters?
Bonus
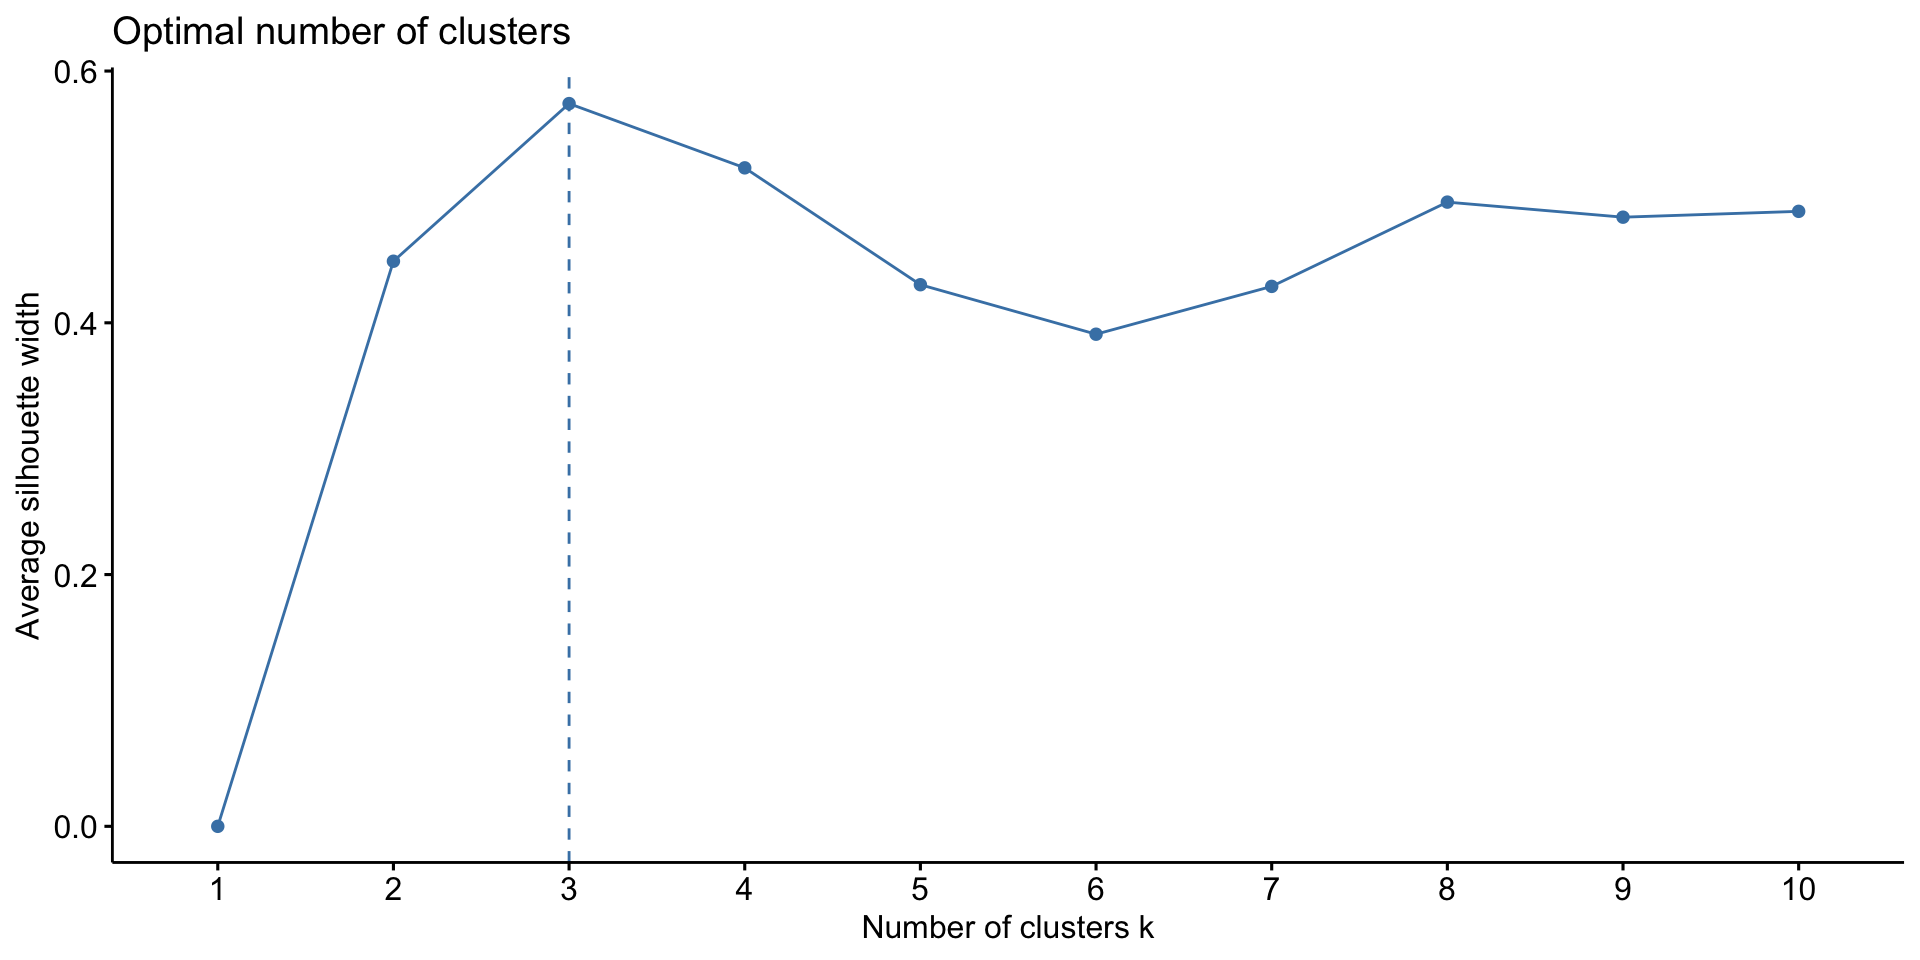
Choosing \(K\) - Average Silhouette
Goal: Choose \(K\) that maximizes the distance between clusters and minimizes distance within clusters
\[a(i) = \frac{1}{|C_I|} \sum_{j\in C_I, i\not=j} ||\mathbf{x}_i - \mathbf{x_j}||^2\] \[ = \text{ avg. within cluster variance or distance from point i}\]
\[b(i) = \min_{J\not=I}\frac{1}{|C_J|} \sum_{j\in C_J} ||\mathbf{x}_i - \mathbf{x_j}||^2\] \[=\text{ min avg. variance / distance from point i to points in another cluster}\]
Silhouette for point \(i\) (\(-1\leq s(i) \leq 1\)):
\[s(i) = \frac{b(i) - a(i)}{\max\{a(i),b(i)\}}\] \[ = \text{relative difference in within and between distance}\] \[ = \text{measure of how tightly clustered a group of points is relative to other groups }\]
Properties of Silhouette
If \(b(i) >> a(i)\) (distance to other clusters is far relative to distance within cluster), \(s(i) = 1\). This means it is an appropriate cluster.
If \(b(i) << a(i)\), point \(i\) is more similar to the neighboring cluster than its own (not great), \(s(i) = -1\).
If \(b(i) = a(i)\), then \(s(i) = 0\). It is more of a flip of a coin of which cluster point i should be in (on the border between 2).
After Class
Upcoming due dates
- 4/11 : Group Assignment 2
- 4/12 : Quiz 2 Revisions
- 4/23 : HW7