3.5 Properties of Least Squares Line
\((\bar{x},\bar{y})\) is ALWAYS on the least squares line.
The residuals from the least squares line ALWAYS sum to 0.
The mean of the residuals from the least squares line is ALWAYS 0.
The standard deviation of the residuals, \(s_e\), gives us a sense of how bad our predictions (based on the line) could be. In other words, it gives us a sense of the size of our prediction errors:
\[s_e = \sqrt{\frac{\sum^n_{i=1} (y_i-\hat{y}_i)^2}{n-2}} = \sqrt{\frac{\sum^n_{i=1} (e_i-0)^2}{n-2}} \]
In R: the standard deviation of the residuals, \(s_e\), is referred to as the “residual standard error”. Don’t confuse this with “Std. Error,” which is something else that we’ll get to later in the semester.
## # A tibble: 2 x 5
##   term        estimate std.error statistic  p.value
##   <chr>          <dbl>     <dbl>     <dbl>    <dbl>
## 1 (Intercept)    -3.19     5.50     -0.580 5.62e- 1
## 2 Neck            2.74     0.145    18.9   4.59e-50
This fit simple linear regression line is
\[ \widehat{\hbox{Chest}} = -3.18 + 2.73\,\hbox{Neck}\]
If you have a neck size of 38 cm, then we predict the chest size of an ideal shirt is about 100.5 cm:
## [1] 100.56# The intercept and slope are not rounded before prediction (better!)
body %>%
with(lm(Chest ~ Neck)) %>%
predict(newdata = data.frame(Neck = 38))## 1
## 100.8131Given your neck size, we can probably predict your chest size within 5 to 10 cm since \(s_e = 5.22\) (1 to 2 SD’s – recall Section 2.6.5).
If you were a shirt manufacturer, is this a good enough prediction? What is the impact on the customer? Think of if the prediction were an overestimate (loose) or an underestimate (too tight).
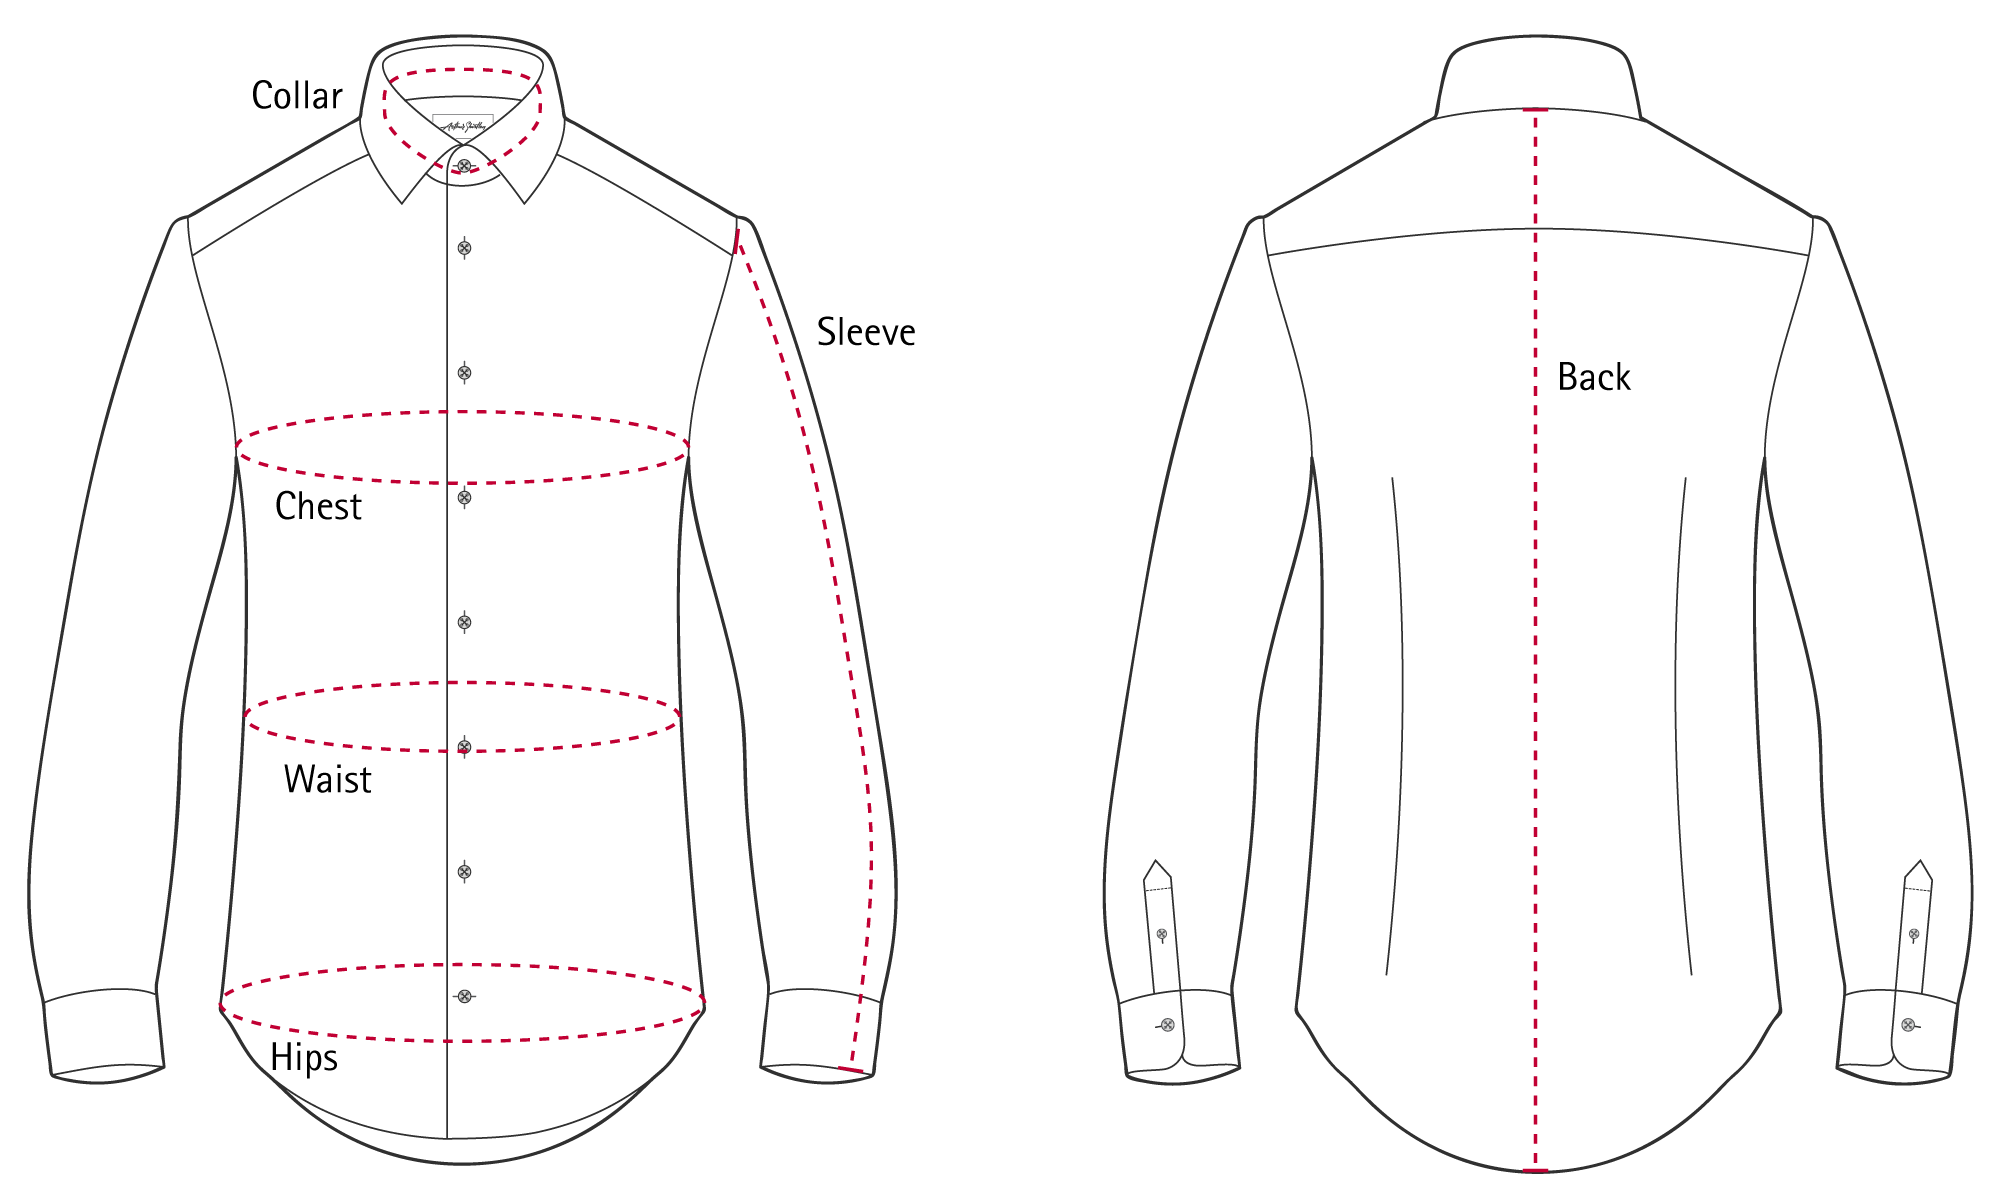
3.5.1 Real companies
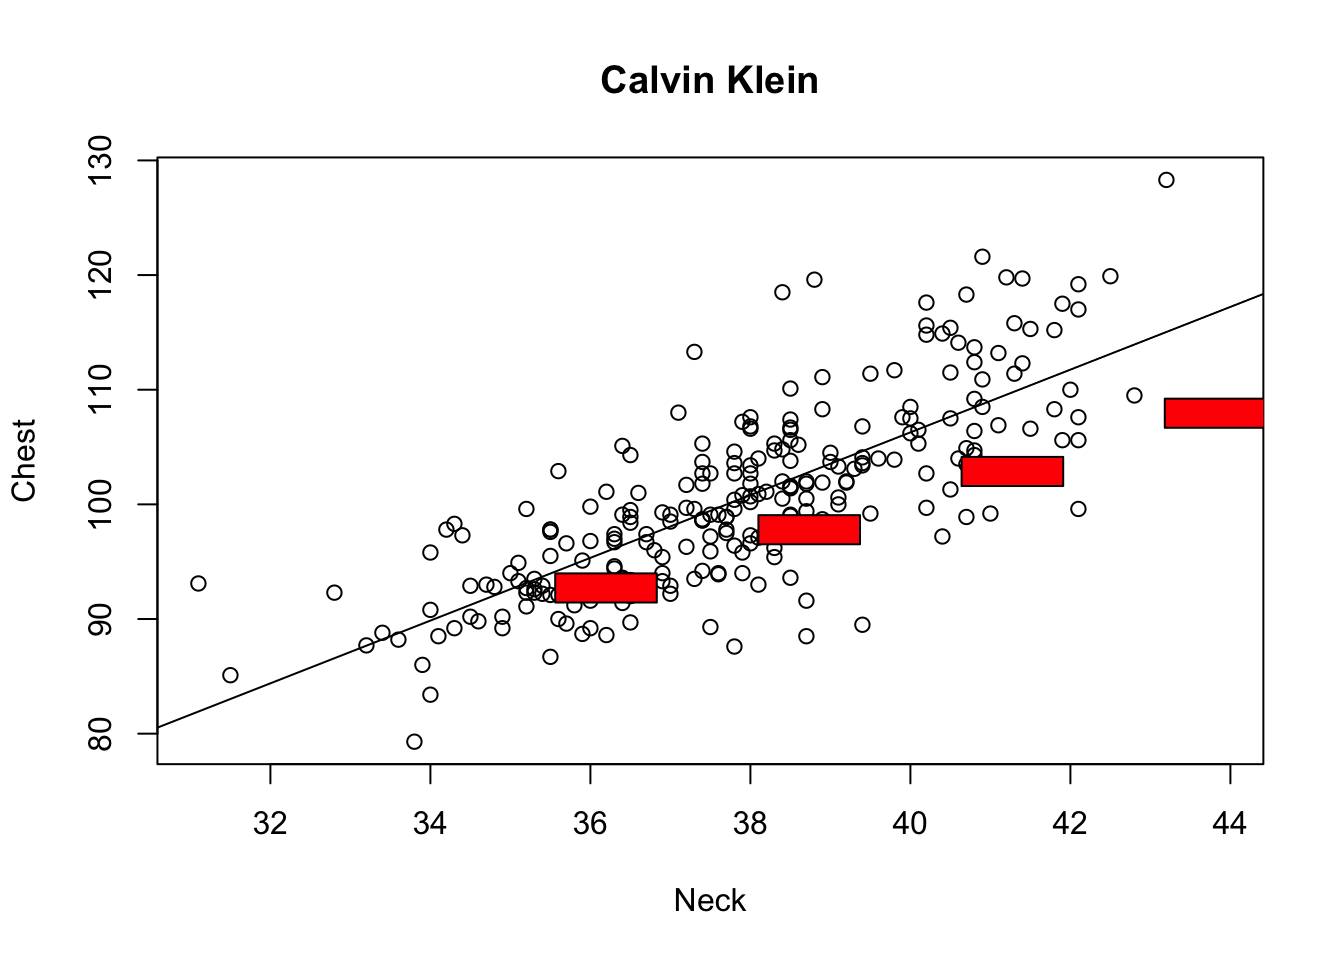
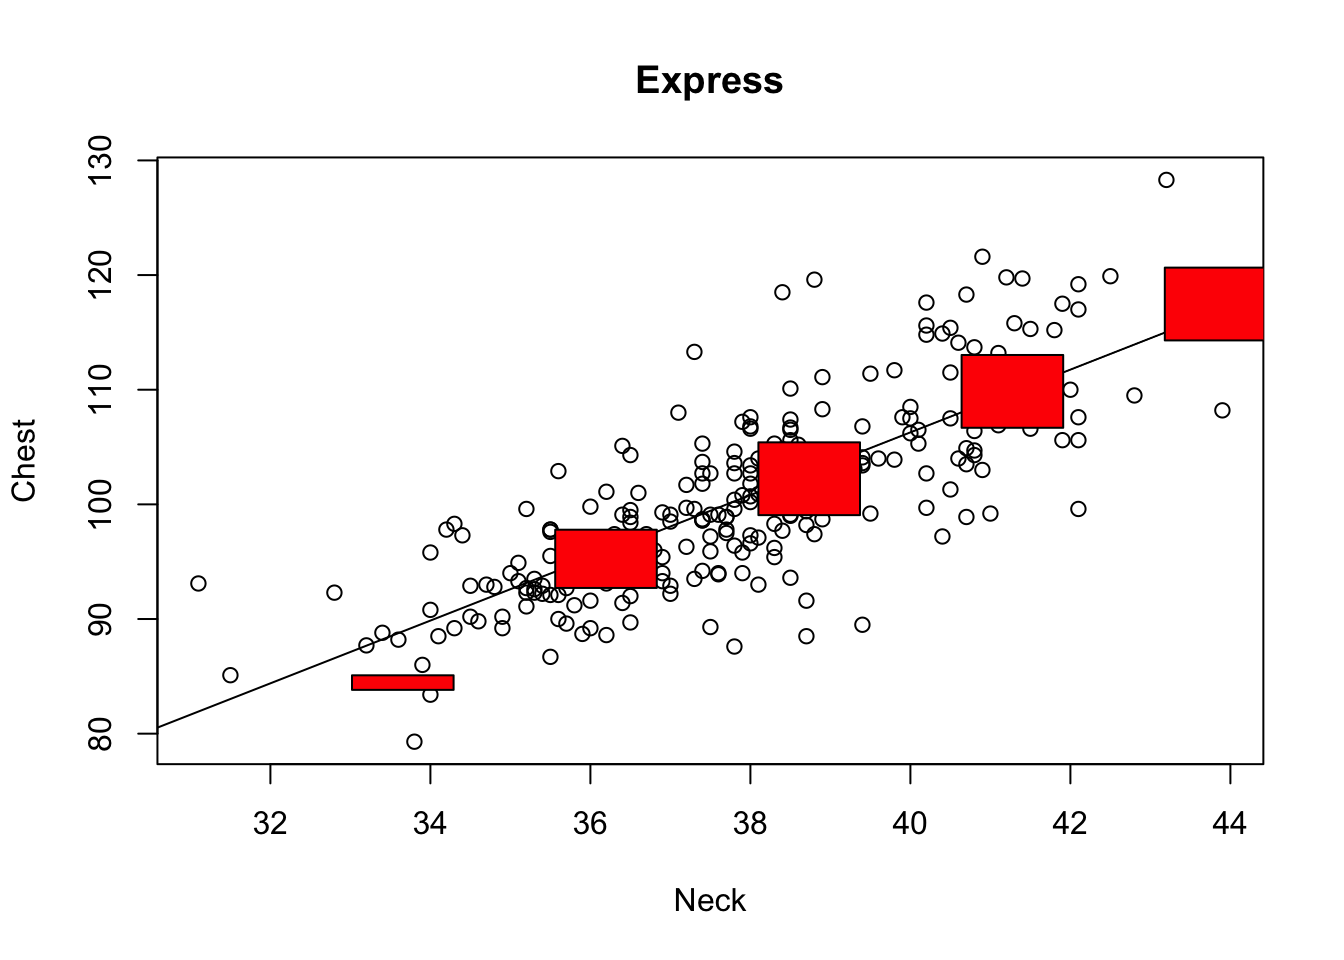
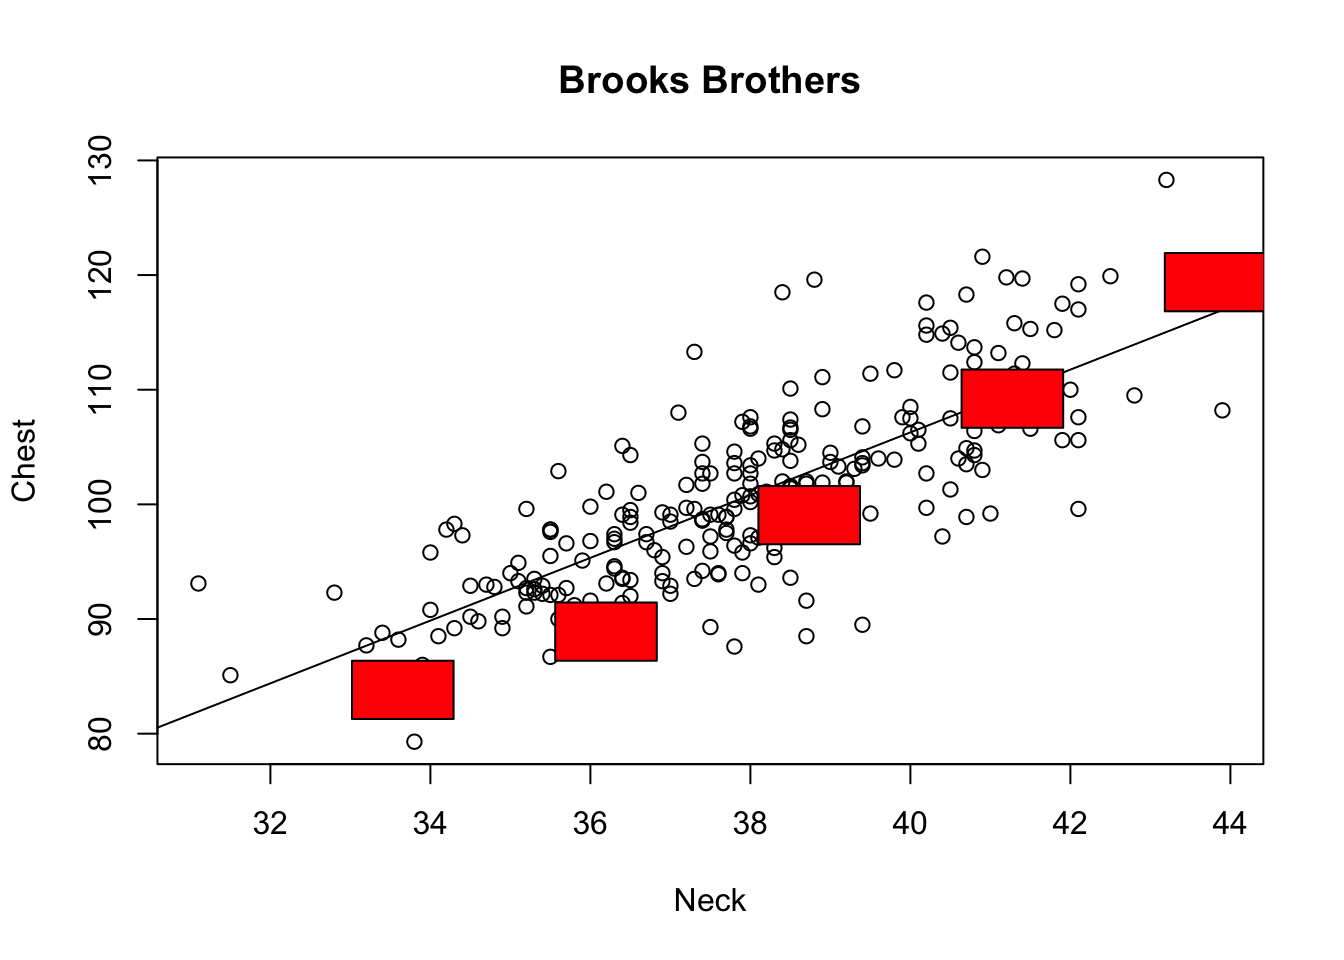
Let’s see how some real companies create shirts. In the plots below, the red boxes represent the advertised range (in cm) for Neck and Chest sizes for each brand.
For Calvin Klein, we see that the red boxes are below the least squares line (black line). So for a given neck size, Calvin Klein makes shirts that are a little bit too small at the chest.
For Express, we see that the red boxes are generally on the least squares line, except for the smallest size. This means that Express shirts are generally a good fit at the chest and neck for the 4 largest sizes, but the smallest shirt size is a bit too small at the chest for the neck size.
For Brooks Brothers, the red boxes are a bit below the least squares line for the 3 smallest sizes and a little above the line for the largest size. This means that the 3 smallest sizes are a bit too small in the chest for our customers (in our data set) with those neck sizes and that the largest shirt is a bit big at the chest for that neck size.
We haven’t told you how the customer data we’ve been using was collected. As you compared the brand sizes to this sample data, what assumptions were you making about the population that the sample was drawn from?
What questions do you have about the sampling procedure?