# Get the Data
library(readr) #install.packages('readr') in Console first
library(dplyr) #install.packages('dplyr') in Console first

inventories <- readr::read_csv('https://raw.githubusercontent.com/rfordatascience/tidytuesday/master/data/2022/2022-09-06/inventories.csv.gz')
inventory_sets <- readr::read_csv('https://raw.githubusercontent.com/rfordatascience/tidytuesday/master/data/2022/2022-09-06/inventory_sets.csv.gz')
sets <- readr::read_csv('https://raw.githubusercontent.com/rfordatascience/tidytuesday/master/data/2022/2022-09-06/sets.csv.gz')
Data Context
LEGO sets
The data this week comes from rebrickable courtesy of Georgios Karamanis.
The LEGO Parts/Sets/Colors and Inventories of every official LEGO set in the Rebrickable database is available for download as csv files here. These files are automatically updated daily. If you need more details, you can use the API which provides real-time data, but has rate limits that prevent bulk downloading of data.
If you’d like to get more data, go to https://rebrickable.com/downloads/ and download any X.csv.gz files.
# I downloaded themes, colors and inventory_parts from the site above.
themes <- readr::read_csv('themes.csv.gz') %>% rename(theme_name = name,theme_id = id)
colors_df <- readr::read_csv('colors.csv.gz') %>% rename(color_name = name, color_id = id)
inventory_parts <- readr::read_csv('inventory_parts.csv.gz')


all_df <- inventory_parts %>%
  left_join(colors_df) %>%
  left_join(inventories, by = c("inventory_id" = "id")) %>%
  left_join(sets %>%
              rename(set_name = name) %>%
              select(set_num,set_name,year,theme_id,num_parts) ,by = "set_num") %>%
  left_join(themes)
Research Question
Develop a research question that you are interested in. You may need to play with the data a little bit to learn more about what the values mean before you decide on a question.
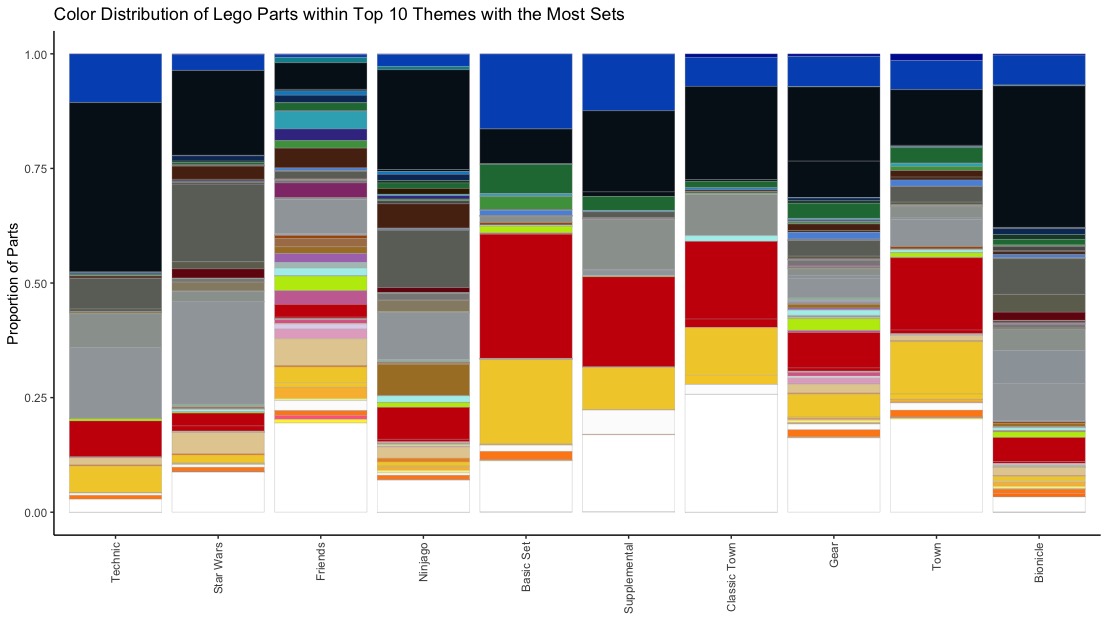
Color Distribution of Parts within Themes and Across Time
Data Visualization
Create a visualization that answers or addresses your research question.
library(ggplot2)
top_themes <- all_df %>%
  distinct(set_num,theme_name) %>%
  count(theme_name) %>%
  arrange(desc(n)) %>%
  slice(2:11) %>% pull(theme_name)

basic_name = colors_df %>% pull("color_name") %>% stringr::word(., -1) %>% gsub("Trans-|Black-|DBGray|-", "", .)

color_pal <- paste0('#',sort(colors_df$rgb))
names(color_pal) <- colors_df$color_name[order(colors_df$rgb)]

all_df %>%
  filter(theme_name %in% top_themes) %>%
  mutate(color_name = factor(color_name,levels = names(color_pal))) %>%
  mutate(theme_name = factor(theme_name,levels = top_themes)) %>%
  group_by(theme_name,color_name) %>%
  summarize(n = sum(quantity)) %>%
  ggplot(aes(x = theme_name, y = n/10000, fill = color_name)) +
  geom_bar(stat='identity',color='darkgrey',size=0.1) +
  scale_fill_manual(values=color_pal,guide='none') +
  theme_classic() + theme(axis.text.x = element_text(angle = 90, vjust = 0.5, hjust=1)) +
  labs(x = '',y ='Number of Parts (10k)',title='Color Distribution of Lego Parts within Top 10 Themes with the Most Sets')
all_df %>%
  filter(theme_name %in% top_themes) %>%
  mutate(color_name = factor(color_name,levels = names(color_pal))) %>%
  mutate(theme_name = factor(theme_name,levels = top_themes)) %>%
  group_by(theme_name,color_name) %>%
  summarize(n = sum(quantity)) %>%
  ggplot(aes(x = theme_name, y = n, fill = color_name)) +
  geom_bar(stat='identity',position='fill',color='darkgrey',size=0.1) +
  scale_fill_manual(values=color_pal,guide='none') +
  theme_classic() + theme(axis.text.x = element_text(angle = 90, vjust = 0.5, hjust=1)) +
  labs(x = '',y ='Proportion of Parts',title='Color Distribution of Lego Parts within Top 10 Themes with the Most Sets')
all_df %>%
  #filter(theme_name %in% top_themes) %>%
  mutate(color_name = factor(color_name,levels = names(color_pal))) %>%
  mutate(theme_name = factor(theme_name,levels = top_themes)) %>%
  group_by(color_name,year) %>%
  summarize(n = sum(quantity)) %>%
  ggplot(aes(x = year, y = n/10000, fill = color_name)) +
  geom_bar(stat='identity', color='darkgrey', size=0.1) +
  scale_fill_manual(values=color_pal, guide='none') +
  theme_classic() + theme(axis.text.x = element_text(angle = 90, vjust = 0.5, hjust=1)) +
  labs(x = '',y ="Number of Parts (10K's)",title='Color Distribution of Lego Parts in Sets over Time')
#color_groups<-read_csv('ColorGroups.csv') %>% rename()


colors_df <- colors_df %>% mutate(HEX = paste0('#',rgb))
colors_df <- colors_df %>% pull(HEX) %>% col2rgb() %>% t() %>% bind_cols(colors_df)

set.seed(123)
colors_df %>% select(red,blue,green) %>% kmeans(centers=5) -> clust


colors_df <- colors_df %>% mutate(color_label= clust$cluster)

color_pal <-colors_df$HEX
names(color_pal) <- colors_df$HEX
colors_df %>% ggplot(aes(x = red,y = blue,color=HEX)) + geom_point() +facet_wrap(~color_label)+ guides(color = 'none') + theme_classic() + scale_color_manual(values=color_pal)
color_pal <- colors_df %>% arrange(color_label,red) %>% pull(HEX)
names(color_pal) <- colors_df %>% arrange(color_label,red) %>% pull(color_name)


all_df %>%
  filter(theme_name %in% top_themes) %>%
  mutate(theme_group = case_when(
    theme_name %in% c('Basic Set','Town','Supplemental','Classic Town') ~ 'Lego Basics',
    theme_name %in% c('Gear','Technic') ~ 'Mechanical',
    theme_name %in% c('Star Wars','Bionicle','Ninjago') ~ 'Action',
    theme_name %in% c('Friends') ~ 'Girl Branded'
  )) %>%
  mutate(color_name = factor(color_name,levels = names(color_pal))) %>%
  mutate(theme_name = factor(theme_name,levels = top_themes)) %>%
  group_by(theme_name,color_name,theme_group) %>%
  summarize(n = sum(quantity)) %>%
  ggplot(aes(x = theme_name, y = n, fill = color_name)) +
  geom_bar(stat='identity',position='fill',color='darkgrey',size=0.1) +
  facet_grid(~theme_group, scales="free") +
  scale_fill_manual(values=color_pal,guide='none') +
  theme_classic() + theme(axis.text.x = element_text(angle = 90, vjust = 0.5, hjust=1)) +
  labs(x = '',y ='Proportion of Parts',title='Color Distribution of Lego Parts within Top 10 Themes with the Most Sets')
