Hot Ones is an American YouTube talk show, created by Chris Schonberger, hosted by Sean Evans and produced by First We Feast and Complex Media. Its basic premise involves celebrities being interviewed by Evans over a platter of increasingly spicy chicken wings.
Rows: 300 Columns: 8
── Column specification ────────────────────────────────────────────────────────
Delimiter: ","
chr  (2): title, guest
dbl  (4): season, episode_overall, episode_season, guest_appearance_number
lgl  (1): finished
date (1): original_release
ℹ Use `spec()` to retrieve the full column specification for this data.
ℹ Specify the column types or set `show_col_types = FALSE` to quiet this message.
Rows: 210 Columns: 4
── Column specification ────────────────────────────────────────────────────────
Delimiter: ","
chr (1): sauce_name
dbl (3): season, sauce_number, scoville
ℹ Use `spec()` to retrieve the full column specification for this data.
ℹ Specify the column types or set `show_col_types = FALSE` to quiet this message.
Rows: 21 Columns: 5
── Column specification ────────────────────────────────────────────────────────
Delimiter: ","
chr  (1): note
dbl  (2): season, episodes
date (2): original_release, last_release
ℹ Use `spec()` to retrieve the full column specification for this data.
ℹ Specify the column types or set `show_col_types = FALSE` to quiet this message.
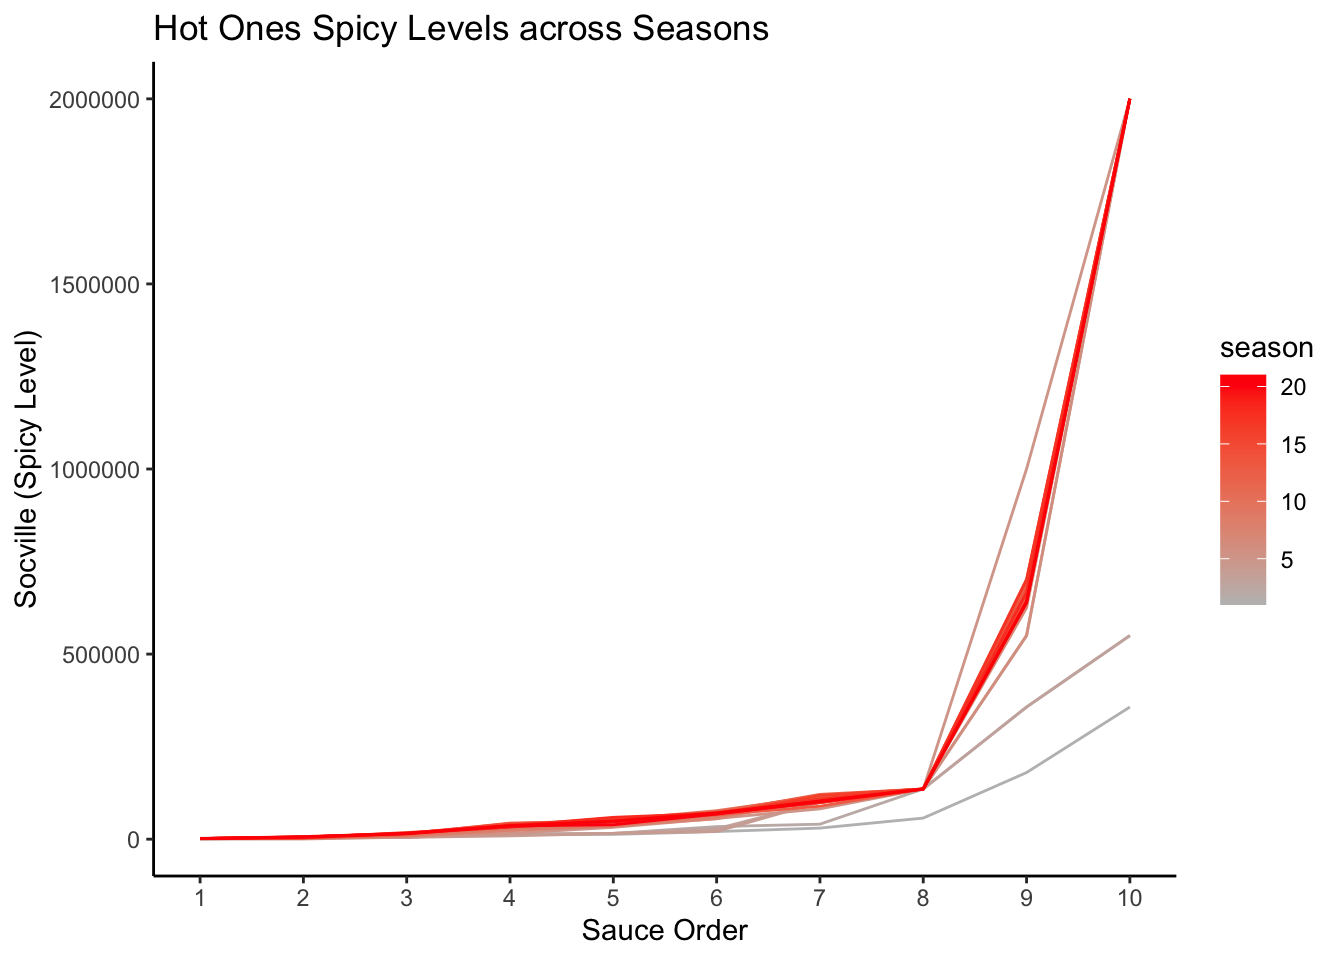
sauces %>%ggplot(aes(y = scoville, x = sauce_number,color = season, group = season)) +geom_line() +labs(y ='Socville (Spicy Level)', x ='Sauce Order', title ='Hot Ones Spicy Levels across Seasons') +scale_x_continuous(breaks =1:10) +scale_color_gradient(low ='grey',high='red')
library(gganimate)
No renderer backend detected. gganimate will default to writing frames to separate files
Consider installing:
- the `gifski` package for gif output
- the `av` package for video output
and restarting the R session
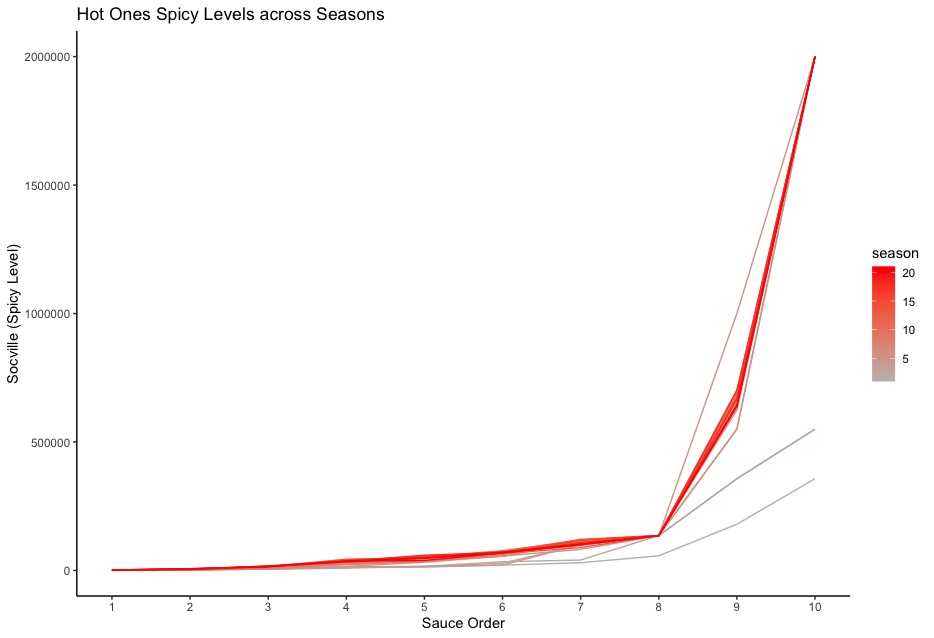
sauces %>%ggplot(aes(y = scoville, x = sauce_number, group = season)) +geom_line(color ='red') +labs(y ='Socville (Spicy Level)', x ='Sauce Order', title ='Hot Ones Spicy Levels across Seasons', subtitle ='Season {round(frame_time)}') +scale_x_continuous(breaks =1:10) +transition_time(season) +shadow_mark(colour ='grey', size =0.75)
Warning: No renderer available. Please install the gifski, av, or magick package to
create animated output