19 Crafting Sentences
TODAY’S GOALS
- Understand the principles of crafting good sentences about data
- Distinguish formal and informal writing styles
- Practice revising sentences for clarity and style
For more on this topic
Read:
- Communicating with Data (Nolan and Stoudt)
WHERE ARE WE?!? Data Storytelling
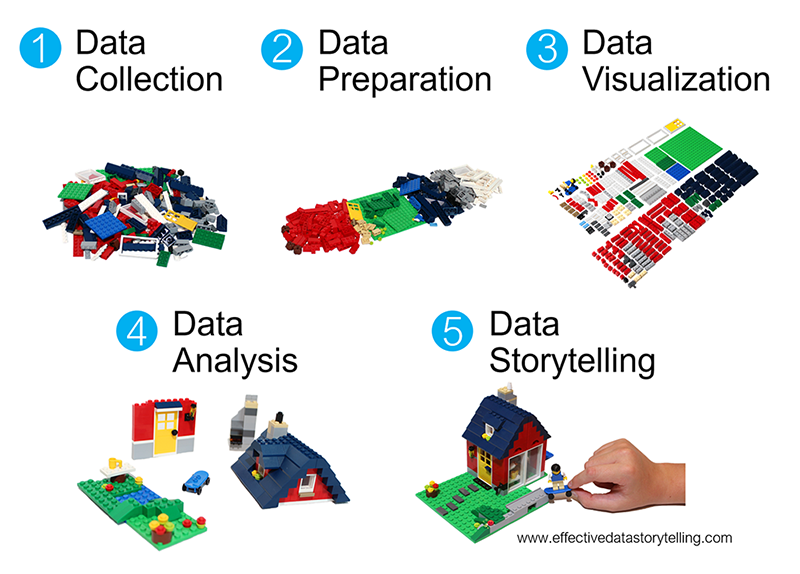
- Data Storytelling is the process of creating a narrative around a dataset. This narrative can be used to inform, persuade, or entertain. It is a way to communicate the insights we’ve gained from our data to others.
19.1 Warm-up
Text and examples taken from Communicating with Data by Nolan and Stoudt.
How can we strengthen our writing about data? Let’s talk about some general principals for crafting sentences.
19.1.1 Crafting sentences
Straightforward sentences
Scientific writing aims to be precise and concise.
- Aim to remove empty phrases that contain no information (e.g. of course, clearly demonstrate, it is obvious, is well known, it should be pointed out that)
- Trim fat phrases (e.g. has the ability to, in the even that, as to whether) and use active verbs instead of passive verbs (e.g. “research program has the aim to develop” to “research will pursue”)
- Reduce strings of modifiers (too many adjectives and adverbs can make a sentence hard to follow; e.g. “The highly complex, often inconsistent, sometimes unreliable, frequently updated, and occasionally incomplete dataset, which was collected over several years by a diverse team of researchers using a variety of methods, presented significant challenges for analysis.”)
- Avoid cliches and colloquialisms (e.g. “the ball is in your court” or “the elephant in the room”)
- Vary sentence structure and length (e.g. mix short and long sentences)
- Straighten out convoluted sentences (avoid too many prepositional phrases; e.g. “The analysis of the data from the experiment, conducted in the laboratory on the third floor of the science building, revealed significant findings with respect to the impact of the new algorithm on the performance of the system, which was installed in the server room adjacent to the data center.”)
EXAMPLE 1
Notice the difference between the original sentence and the revision. Why is the revision better? Discuss with your group.
Original: “In this part of our analysis, we assume that flight delays that last more than 15 minutes have minimal effects on passengers, and so we reduce our large dataset into a smaller subset in which all departure delays are at least fifteen minutes long.”
Revision: “Since short departure delays have minimal impact on travelers, we analyzed only those flights where the delay was longer than 15 minutes.”
Word choice
Use nouns as stepping stones in a sentence and active verbs to help you move from one noun to the next.
- Use concrete nouns (avoid imprecise pronouns “it” or “this”)
- Use strong action verbs (avoid weak passive verbs like “is” or “have”)
- Hot Tip: If you are afraid your sentence is in the passive voice, add the phrase “by zombies.” If the sentence still makes sense, it is in the passive voice. Source
- Match word connotation with the context (e.g. avoid words with negative connotations in a context that is positive or neutral)
- Be careful with swapping with synonyms (not all synonyms are interchangeable)
- Avoid overly complex words (e.g. words ending in ‘ize’, ‘ization’, or ‘ability’)
- Remove redundant words (e.g. “mixing together”, “already existing”, “introduced a new”)
EXAMPLE 2
Notice the difference between the original sentence and the revision. Why is the revision better? Discuss with your group.
Original: “Thanks to my model’s output I was able to determine that there is a significant relationship between a mother’s smoking behavior and her baby’s weight.”
Revision: “The model output showed a significant relationship between a mother’s smoking behavior and her baby’s weight.”
Grammar details
Grammatical details can make a big difference in the clarity of your writing.
Check for:
- Subject and verb agreement (Singular subjects require singular verbs; plural subjects require plural verbs)
- Complete comparisons; what are you exactly comparing? (e.g. “better than any other” should be “better than any other model”)
- Parallel word structure (e.g. “to analyze, to interpret, and to present”)
- Lack of sentence fragments (e.g. “A statistical test may be used when the data is normally distributed” instead of “The statistical test may be used. But only when the data is normally distributed.”)
- Consistent verb tense / correct part of speech (e.g. “Some researchers feel bad about the treatment of lab animals” instead of “Some researchers feel badly about the treatment of lab animals” )
- Correct use of prepositions (e.g. “The data was collected from the participants” instead of “The data was collected off the participants”)
- Lack of run-on sentences
Hot tip: Use a free-version of Grammarly.com to help you catch these grammatical details.
EXAMPLE 3
As a group, try to write a more straightforward version of one of the following sentences about data:
Original 1: After understanding interaction between peers, I am interested in investigating the impact of video games and televisions on math scores; whether spending more time on entertainment would help students perform better in math.
Original 2: According to all the findings regarding seasonal effects on delay, it is reasonable to recommend passengers to reduce their times to take a flight in the summer and winter season.
Original 3: The data are scraped from San Francisco Chronicle weekly. However this feature is provided by the California Resource, a title abstracting company. And all the detailed information are collected from SF Bay Area Counties house transactions.
Put your revision in this Google Doc.
19.1.2 Writing with numbers
The following is adapted from Numbers in the Newsroom by Sarah Cohen
- Keep the number of digits in a paragraph below 8.
- Before: The Office of Redundancy’s budget rose 48 percent in 2013, from $700.3 million to $1.03 billion.
- Revision: Over the past year, the Office of Redundancy’s budget grew by nearly half, to $1 billion.
- Round a lot
- Only use precision when it matters. For example, never round when it comes to death counts; every body matters.
- Think in ratios
- We can’t think clearly about very big or very small numbers. Make the numbers you deal with understandable by contextualizing them.
- Example: A widely quoted estimate of fixing the Year 2000 computer bug was $50 billion for U.S. companies. How big is $50 billion? At the time, it was smaller than Bill Gates’ net worth. It was the cost of two hurricanes. It was the income of people living in the Portland, Ore., area.
- Use devices from everyday life
- Most people have some arithmetic that they perform instinctively (e.g. discounts in retail, tipping at a restaurant, 2 to 1 odds). Convert your writing into the commonly used scales.
- Keep in mind that a percent change (a multiplicative change) is very different from a percentage point difference (an additive change). Both are correct:
- Population growth has slowed by about 1.3 percentage points since its peak in 1950, to 0.7 percent. (Simple difference between 2 percent and 0.7 percent, expressed in percentage points.)
- Population growth in the U.S. slowed by almost two-thirds from its peak in 1950, to 0.7 percent in 2013. (Percent difference between 2 percent and 0.7 percent)
19.1.3 Writing style
Good scientific writing is clearly explains concepts and shares information to a broad audience. For most writing about data, you aim to describe what you found out about the data and the larger context.
One of the most important things to consider in writing is the audience and goal of the communication.
- Audience: What can you assume they know about the data context? What can you assume they know about statistical methods? What data visualizations can you assume they are familiar? What are their goals in reading your writing?
- Goal: What do you want your audience to do with the information you provide? What do you want them to take away?
Describing Findings
Depending on the audience and goal, you may want to describe your findings in different ways.
- Path you Traveled: Describe the steps you took to get to your findings. This is useful when you want to show the process of data analysis and document each step. This is typically only relevant if the audience is a fellow data scientist or statistician. If you are the main audience for the writing, this is a good way to keep track of your own work.
- What you Found: Describe enough of your process to get to your findings. The goal is for a reader to understand how to reproduce your work; commented code makes the process fully reproducible. This means you won’t necessary describe the process in the order it was carried out in chronological order and some tangential exploration may not be included. This approach is useful when you want to show the results of your data analysis. This is typically relevant if the audience is a broad or has more expertise in the data context. This is a good way to communicate the results of your work to others.
Informal v. Formal Style
Depending on the audience and goal, you may want to write in different styles.
- Informal: This style is more conversational and is often used in blog posts, emails, and other informal writing. It is often more engaging and can be more fun to read. The style allows the writer’s personality to come through. You can often break some of the principles of crafting sentences in this style:
- Fat Phrases: You can use more fat phrases and colloquialisms as it provides the reader insight into the writer’s thought process.
- Path you Traveled: You are more likely to describe the path you traveled in this style.
- First Person: You can use first person (using “I” and “me” in the writing). You as the writer can insert themselves in the story.
- Conversational: You can use contractions and more colloquial language.
- Formal: This style is more precise and clear. It is often used in academic writing through journal articles, technical reports, and other formal writing. It is often less “fun” to read. However, it is more precise and clear. You should follow the principles of crafting sentences in this style:
- Trim Fat Phrases: You should remove fat phrases and empty phrases.
- What you Found: You are more likely to describe what you found in this style.
- Third Person: You should avoid first person (using “I” and “me” in the writing). The writer should not insert themselves in the story.
- Precise: You should avoid contractions and colloquial language.
19.2 Exercises
Exercise 1: Change style
Read the original text of a blog.
On December 12, 2019, Disney unveiled its streaming service, Disney+, to the world. It received significant attention, both good and bad, from the press–which makes sense, because over 10 million people signed up in the first day.
Twitter was also abuzz with conversations about Disney+ (see this string-of-tweet “news story” about Twitter activity on the first day). Several pointed out that shows including new ones like The Mandalorian and oldies like Darkwing Duck, were trending soon after Disney+ was launched.
What would activity look like after the first day?
To answer this question, I used Mike Kearney’s rtweet package to look at tweets posted from 11/14/19 to 11/18/19 that had one of the following keywords: disneyplus, disney plus, disney+, and disney +. …
I also ran an LDA topic modeling, which highlights the variety of conversations on Twitter about Disney+.
Noticeably, The Mandalorian, Hannah Montana, the Simpsons (which is on Disney+ in its original 4:3 format), and Bad Girls Club were talked about frequently enough to be (mostly) stand-alone topics. The Mandalorian hashtag (#themandalorian) was also a popular keyword in the corpus.
But we also see a variety of other topics, including one about the Nickelodeon and Netflix deal (which many people viewed as a response to Disney+’s explosive popularity) and another comparing Disney+ to other streaming services (like Netflix, Hulu, and HBO). In fact, Netflix was the third most frequent term in the dataset (behind Disney and Disneyplus).
(Some of the topics were obviously noisier than others. Topics with the little red “n” are “noisier” than the others, meaning that a large number of tweets with a high beta in that topic were not related to the topic labels. Many tweets in the “Bad Girls Club” topic, for example, don’t actually have to do with that show.)
With your group, identify phrases you would remove if you wanted a more formal writing style. List these phrases in this Google Doc.
Exercise 2: Brainstorm
In your project groups:
come up with as many ideas of one number summaries (e.g. mean, median, max, min, count, percent, ratio, etc.) that might address your broad research question
Mac Student Data Example:
- Percentage of students who have more than 1 major
- Percentage of students who only take the bare minimum of courses in divisions outside their major division
- Mean number of concentrations per student
- Max number of concentrations per student
- Max number of courses per division
Exercise 3: Calculate
Choose one summary and calculate that 1 number from your project data.
- Within the project group, each student should choose a different numerical summary.
Exercise 4: Draft of One Number Story (Project Milestone 4)
For the rest of class time, each group member should open a new Google Document and start drafting a honest, ethical data story around that 1 number.
- 250-500 words
- include a title/headline
- focus on 1 number that you calculate from your data but you can include other numbers to contextualize your numerical summary (“as compared to what”)
- apply the principles of crafting sentences
- apply the principles of writing with numbers
Timeline
- Write a rough draft due 11/21
- You’ll give/get peer feedback in class on 11/21
- Revised based on feedback and submit a final draft due 11/26
19.3 Wrap-up
- Homework 8 due tonight (last homework!)
- Project Milestone 3 due next Tuesday to Moodle
- Finalize data
- Read data into R
- Start cleaning/wrangling/exploring data