Homework 2
Skills challenges
Navigate to GitHub Classroom. Accept the assignment. This will create a Github repository for you. Clone this repository to your local machine using Github Desktop (click Set up in Desktop). Set the Local Path to your homework folder in your class folder.
There are two tasks and thus they are separated into two files. You are expected to completed both tasks.
Advanced visualization with ggplot2 Open
HW2_Part1.qmd. This challenge involves finishing the plot that we started in our Advanced Data Visualization in ggplot2 class activity. See the file fore more details and expectations.Advanced visualization with ggplot2. Open
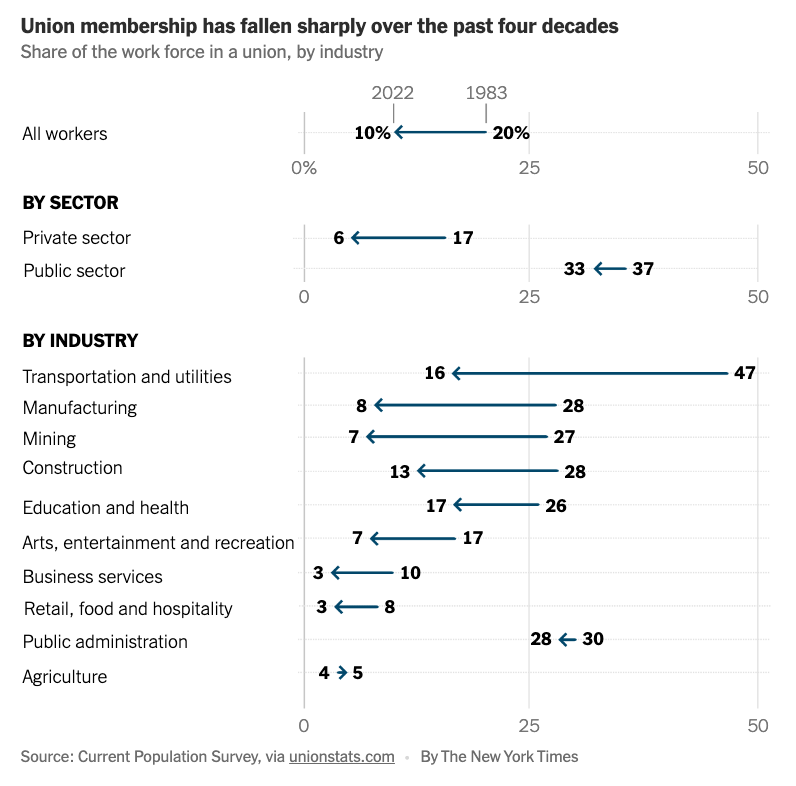
HW2_Part2.qmd. This involves recreating the following NY Times visualization (including creating the dataset). See the file for more details and expectations.
To turn in your work,
- Render each qmd file to get a readable html file.
- Commit and push your work to Github using Github Desktop by the deadline.
Practice Keyboard Shortcuts
Nothing to turn in for this section, but please do the following:
- The benefits of being fluent with keyboard shortcuts will be immediately useful, and it will take time to practice these shortcuts.
- Use the keyboard shortcut notes as an introduction to the shortcuts we’ll use in this course.
Concepts to Know
- Layers in ggplot with different datasets
- Customizing visuals with ggplot
- Understanding how to adjust aspects of the ggplot theme (text style, margin sizes, etc.)
- Combining ggplots into one frame
Optional
If you are aiming for an A in the course, recall from our syllabus that participating in 3 Tidy Tuesday challenges can move you toward this goal. You’ve already created 1 for HW1. These are great to include in your digital portfolio.
Participate in the most recent Tidy Tuesday challenge.
- Within your existing Tidy Tuesday Github folder (on your local machine), create a folder named the date of the tidy tuesday in
yyyy-mm-ddformat. - Within the
yyyy-mm-ddfolder, create a new qmd file. Read in the data (use theread_csv()approach) and explore the data. The Readme for the TidyTuesday has documentation about the data for the week. - Use the week’s data to create one visual that tells a story. Don’t spend more than 1-2 hours on this, but use it as an opportunity to review 112 material.
- Push your work to Github using Github Desktop.
Turn in your work:
- share an image (png or jpeg) of a visual you created for the Tidy Tuesday that you are proud of in the #sharing-is-caring channel on Slack
- share a link to a Github repository created for your Tidy Tuesday work to the #sharing-is-caring channel on Slack.