# Run in Console
install.packages("reticulate")Python
Main Differences between R and Python
- Purpose: Python is a general-purpose programming language, whereas R is a language specifically designed for data analysis and visualization
- Syntax: Python explicitly uses object oriented programming style with
object.method_or_propertysyntax, whereas R is more functional-focused withfunction(object, arguments)orobject %>% function(arguments)syntax - Data Structures: Python has a few basic data structures (lists, dictionaries, sets, tuples), whereas R has a wide variety of data structures (vectors, matrices, arrays, data frames, lists)
- Packages/Libraries: Python has a large number of libraries for data analysis (e.g., pandas, numpy, scipy, matplotlib, scikit-learn), whereas most data science packages we use in R are packaged together in tidyverse (e.g., dplyr, ggplot2, tidyr)
- Data Visualization: Python has a few libraries for data visualization (e.g., matplotlib, seaborn, plotly), whereas R has a wideer variety of data visualization libraries (e.g., ggplot2, plotly, shiny, lattice)
- Statistical Modeling: Python has a few libraries for statistical modeling (e.g., statsmodels, scikit-learn), whereas R has many established and cutting-edge libraries for statistical modeling (e.g., lm, glm, lme4, nlme)
- Machine Learning: Python has libraries for machine learning (e.g., scikit-learn, tensorflow, keras), whereas R has a fewer packages for machine learning (e.g., tidymodels)
For more information: https://www.geeksforgeeks.org/r-vs-python/
Translating between R and Python
Prof. Brianna Heggeseth created a table of common data science tasks in R and their equivalent in Python. See this Google Doc.
To get started with Python, you could use Co-Pilot to help you write Python code. Articulate your task in the comments within a Python chunk and it will generate some code to get you started. Otherwise, the following tutorials can give you an overview of the library functionalities.
Numpy Tutorial for basic scientific computing Pandas Tutorial for data manipulation/wrangling
Matplotlib Tutorial for data visualization.
Setup in RStudio
Start by installing the reticulate package in RStudio. This package allows you to run Python code in RStudio.
Next, install Python. You can install a Miniconda distribution of Python using the reticulate package.
# Run in Console
reticulate::install_miniconda()
You can install Python packages using the py_install function. We’ll install a few common packages for data analysis and visualization:
# Run in Console
py_install(packages = c("matplotlib", "pandas", "numpy"))
For more information, see https://support.posit.co/hc/en-us/articles/1500007929061-Using-Python-with-the-RStudio-IDE
Python in RStudio
There are many ways to work with Python code in RStudio.
- You can open .py files in RStudio and run them.
- Include Python and R code chunks in a Quarto file
We’ll focus on the second. Here’s an example of how to include Python code in a Quarto file.
- Start with importing packages in R and then libraries in Python.
```{r}
# R Chunk
# Load in the tidyverse package
library(tidyverse)

# Load the reticulate package
library(reticulate)
```
```{python}
# Python Chunk
#Load in numpy library
import numpy as np
# Load in pandas library
import pandas as pd
# Load in matplotlib library
import matplotlib
matplotlib.use("Agg", force=True)
import matplotlib.pyplot as plt
```- To continue working in Python, use another Python code chunk.
```{python}
# Python Code Chunk
```
Here is an example of an evaluated Python code chunk that does some basic summary and visualization on a Tidy Tuesday dataset.
# Load in the dataset
data = pd.read_csv('https://raw.githubusercontent.com/rfordatascience/tidytuesday/master/data/2024/2024-05-14/coffee_survey.csv')
data.head()
submission_id age ... number_children political_affiliation
0 gMR29l 18-24 years old ... NaN NaN
1 BkPN0e 25-34 years old ... NaN NaN
2 W5G8jj 25-34 years old ... NaN NaN
3 4xWgGr 35-44 years old ... NaN NaN
4 QD27Q8 25-34 years old ... NaN NaN
[5 rows x 57 columns]# Give a summary of the data
data.describe() expertise ... coffee_d_personal_preference
count 3938.000000 ... 3764.000000
mean 5.693499 ... 3.375930
std 1.948867 ... 1.452504
min 1.000000 ... 1.000000
25% 5.000000 ... 2.000000
50% 6.000000 ... 4.000000
75% 7.000000 ... 5.000000
max 10.000000 ... 5.000000
[8 rows x 13 columns]# Give a summary of "cups" column by "age"
data.groupby('age')['cups'].describe() count unique top freq
age
18-24 years old 447 6 1 166
25-34 years old 1956 6 2 828
35-44 years old 948 6 2 428
45-54 years old 296 6 2 121
55-64 years old 182 6 2 78
<18 years old 19 4 2 7
>65 years old 94 6 2 37# Give the frequency of "cups" by "age"
data.groupby('age')['cups'].value_counts()age cups
18-24 years old 1 166
2 160
Less than 1 70
3 33
4 10
More than 4 8
25-34 years old 2 828
1 689
3 206
Less than 1 176
4 39
More than 4 18
35-44 years old 2 428
1 274
3 131
Less than 1 65
4 36
More than 4 14
45-54 years old 2 121
1 85
3 47
Less than 1 16
4 14
More than 4 13
55-64 years old 2 78
3 38
1 36
4 15
Less than 1 9
More than 4 6
<18 years old 2 7
1 6
Less than 1 5
3 1
>65 years old 2 37
1 21
3 17
4 7
More than 4 7
Less than 1 5
Name: count, dtype: int64# Make a stacked barplot of "cups" by "age"
data.groupby('age')['cups'].value_counts().unstack().plot(kind='bar', stacked=False)
plt.show()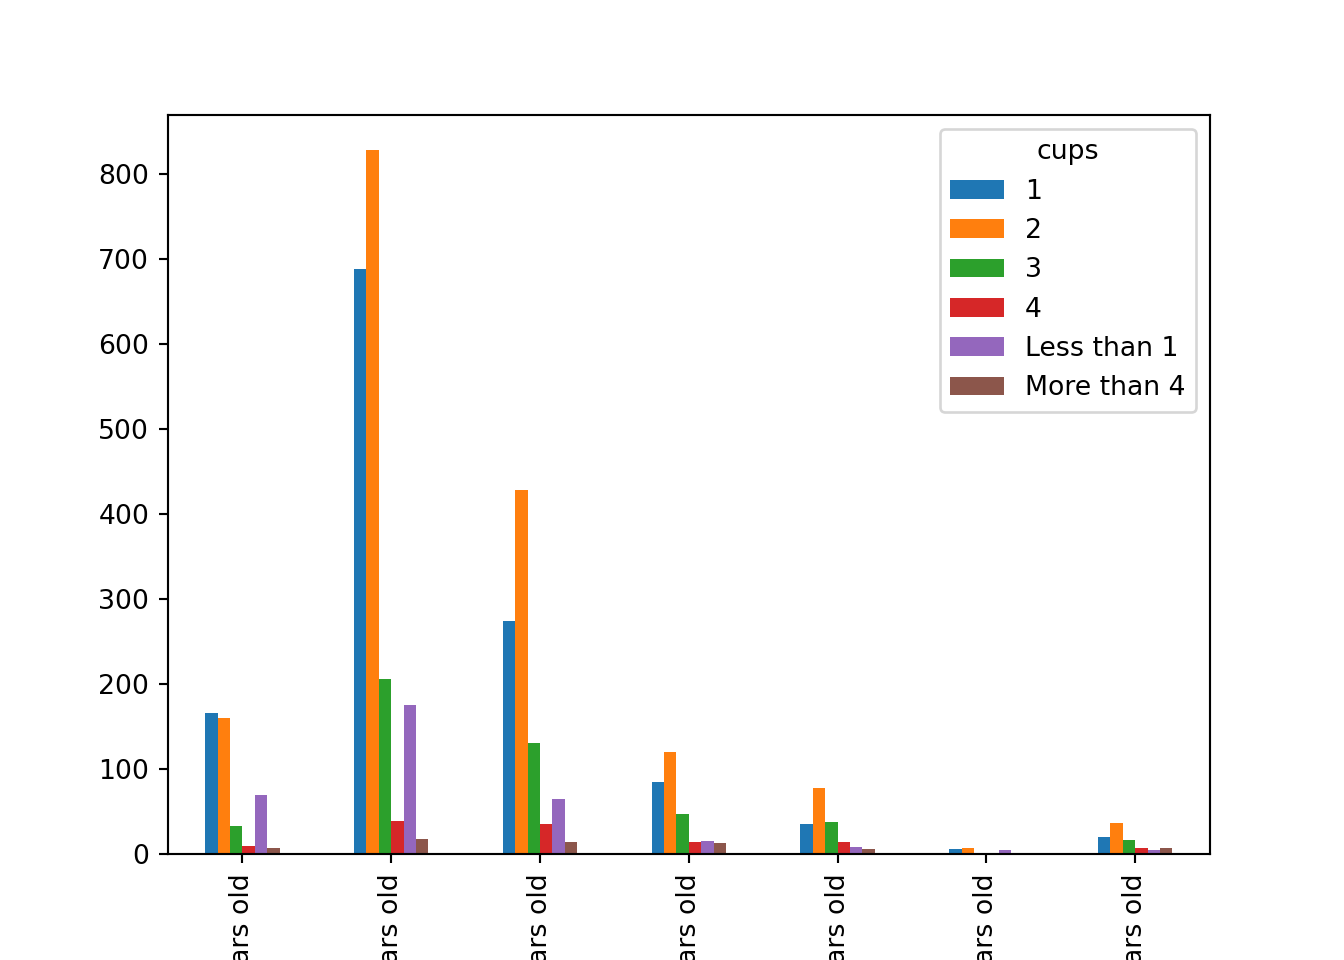
Switching between R and Python
Whether you are working in the Console or in a Quarto file, you can switch between R and Python code.
Console
To start an interactive session in Python, run the following in the R Console:
reticulate::repl_python()Your Console will be in “Python Mode” and look like the following:
> reticulate::repl_python()
Python 3.10.14 (/Users/bheggese/Library/r-miniconda-arm64/envs/r-reticulate/bin/python)
Reticulate 1.38.0 REPL -- A Python interpreter in R.
Enter 'exit' or 'quit' to exit the REPL and return to R.
>>>
To switch the Console from “Python Mode” to “R Mode”, you can type exit in the Python Console.
Code Chunks
In a Quarto file, you can switch between R and Python code chunks by specifying the language in the chunk options.
```{r}
# R Code goes here
# R objects are made (data_from_r)
```
```{python}
# Python Code goes here
# Python objects are made (data_from_python)
```You can pass objects between R and Python code chunks using the py and r objects. For example, see the pseudo code below that passes data objects between R and Python code chunks.
```{python}
r.data_from_r
```
```{r}
py$data_from_python
```