6.6 Normal Model
We’ve been introduced to the Normal model already as a smooth version of a unimodal, symmetric histogram. For a quantitative random variable \(X\) (whose value can be any real number), if the expected value is \(\mu\) and the variance is \(\sigma^2\), a Normal random variable has a probability density function of \[f(x) = \frac{1}{\sigma\sqrt{2\pi}}e^{-\frac{(x-\mu)^2}{2\sigma^2}}\]
For every potential value of \(\mu\) and \(\sigma\), there is a different function/curve. Some examples are shown below.
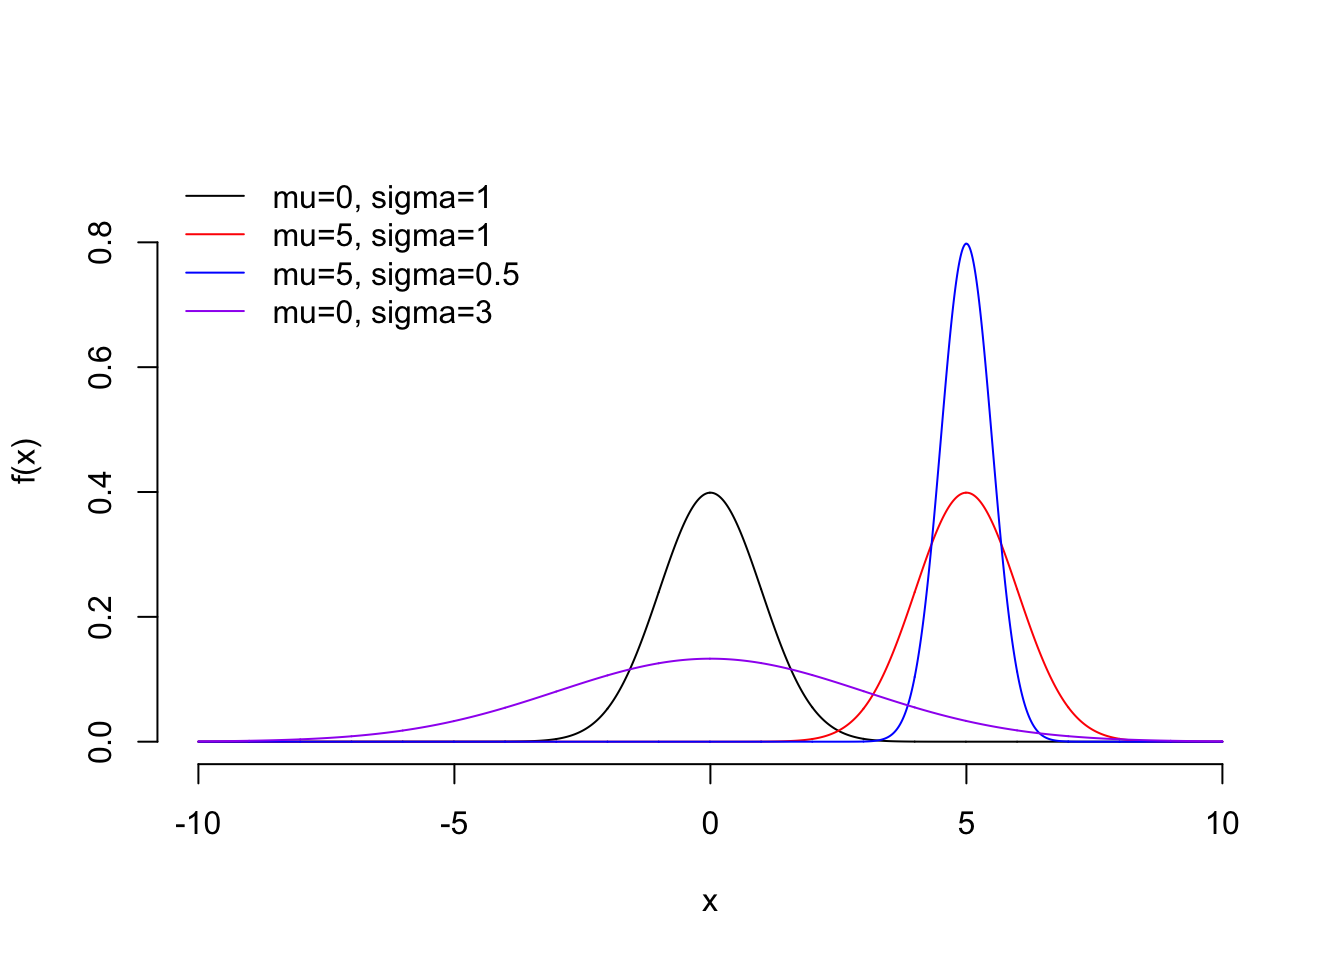
If a random variable \(X\) is modeled with a Normal model, we also say that “\(X\) follows a normal distribution” or that “\(X\) is normally-distributed”.
- In general, the center of the distribution is \(\mu\) and the standard devation \(\sigma\), the square root of the variance, determines the spread of the distribution.
- Let’s consider the particular Normal model with \(\mu=0\) and \(\sigma=1\). This is called the standard normal distribution. We know that \(P(-1\leq X \leq 1) = 0.68\), which is calculated as the area under the curve between -1 and 1.
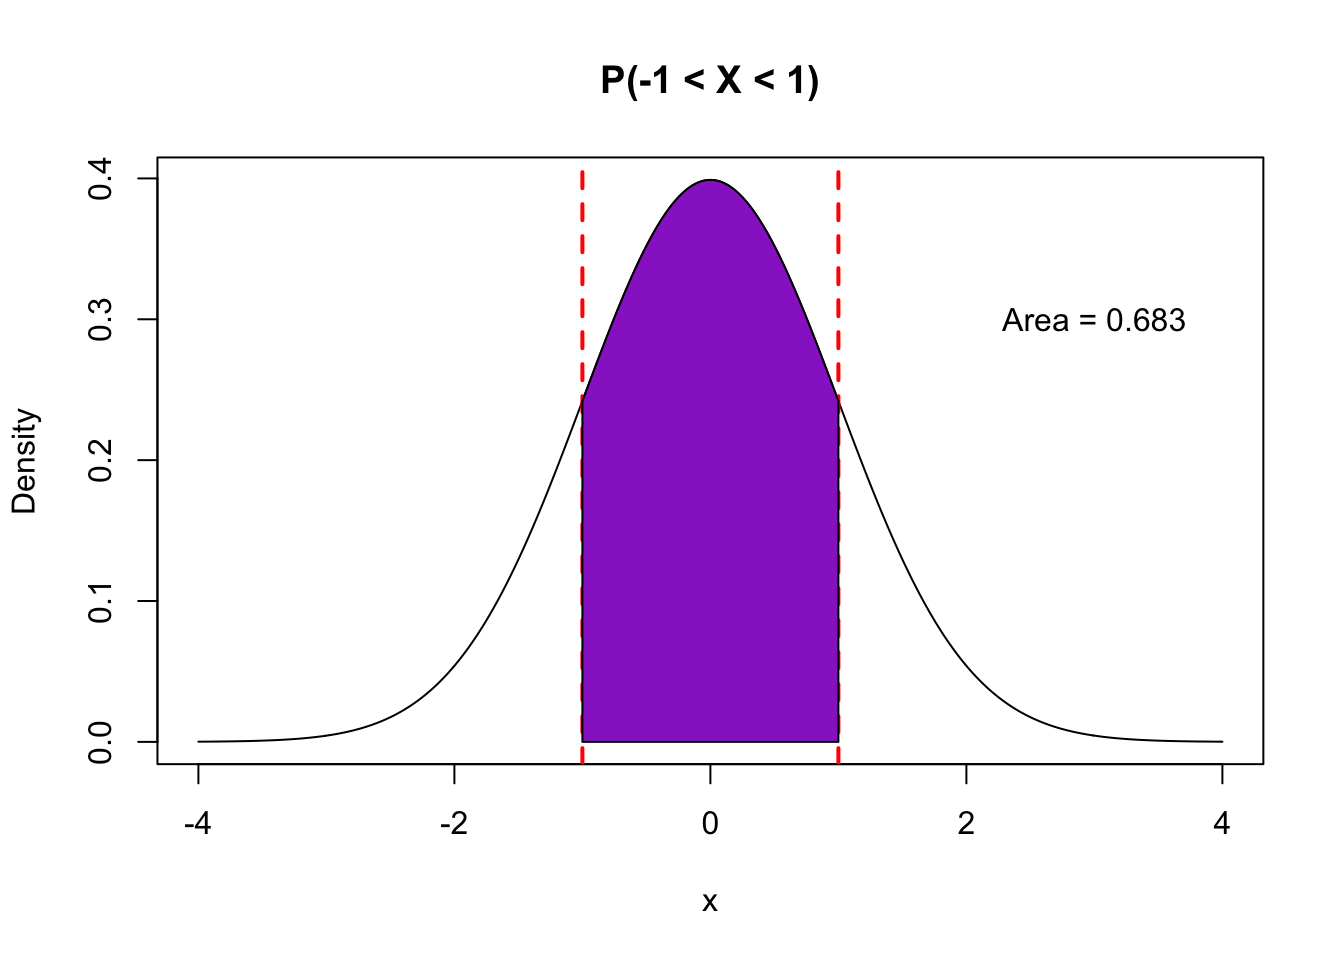
## [1] 0.6826895#pnorm(1) gives the area under the curve to the left of 1
#pnorm(-1) gives the area under the curve to the left of -1- We know that \(P(-2\leq X \leq 2) = 0.95\), calculated as the area under the curve between -2 and 2.
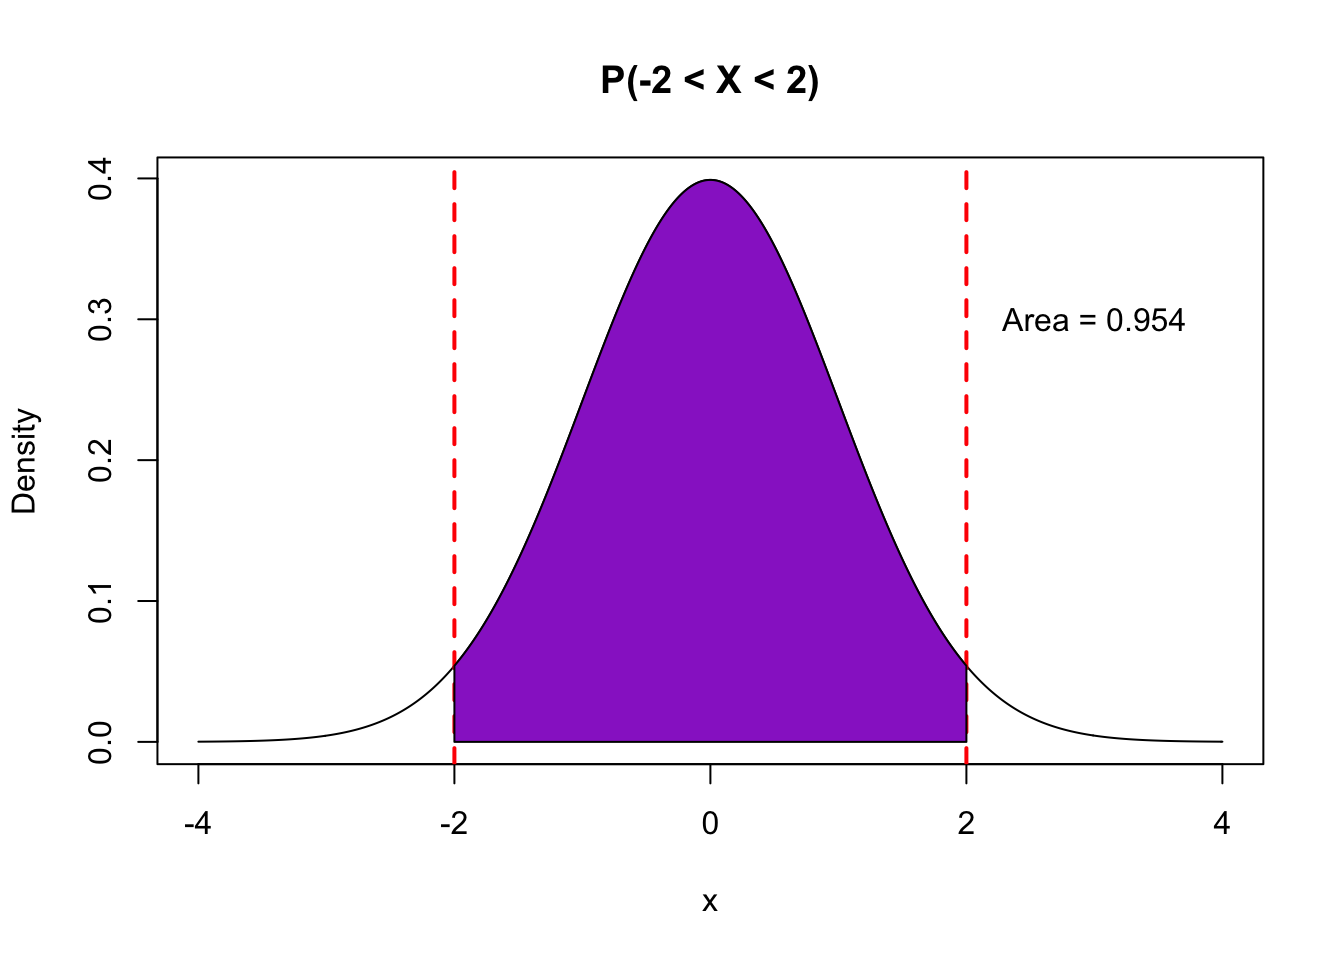
## [1] 0.9544997- We know that \(P(-3\leq X \leq 3) = 0.997\), calculated as the area under the curve between -3 and 3.
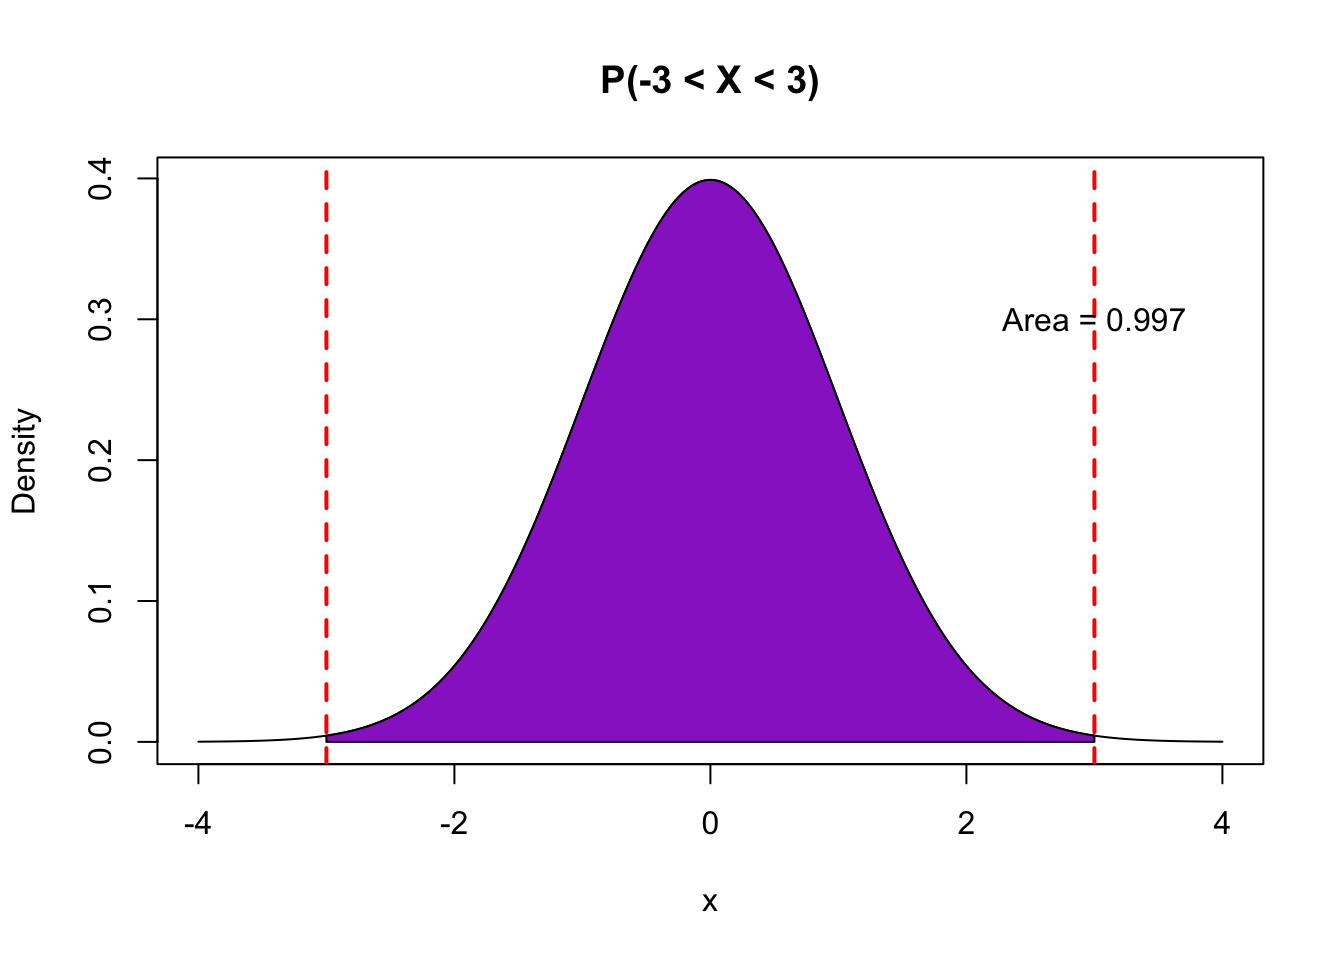
## [1] 0.9973002The standard normal distribution is very convenient to work with. No matter what the long-run average \(\mu\) and standard deviation \(\sigma\) are for a normally-distributed random variable \(X\), we can standardize the values to obtain z-scores by subtracting \(\mu\) and dividing by \(\sigma\):
\[\text{z-score} = \frac{X - \mu}{\sigma}\]
We typically denote z-scores with \(Z\). It turns out that \(Z\) follows a standard normal distribution. That is \(\mu=0, \sigma=1\) for \(Z\). This allows us to focus solely on the areas for the standard normal distribution rather than the particular normal distribution with mean \(\mu\) and standard deviation \(\sigma\).
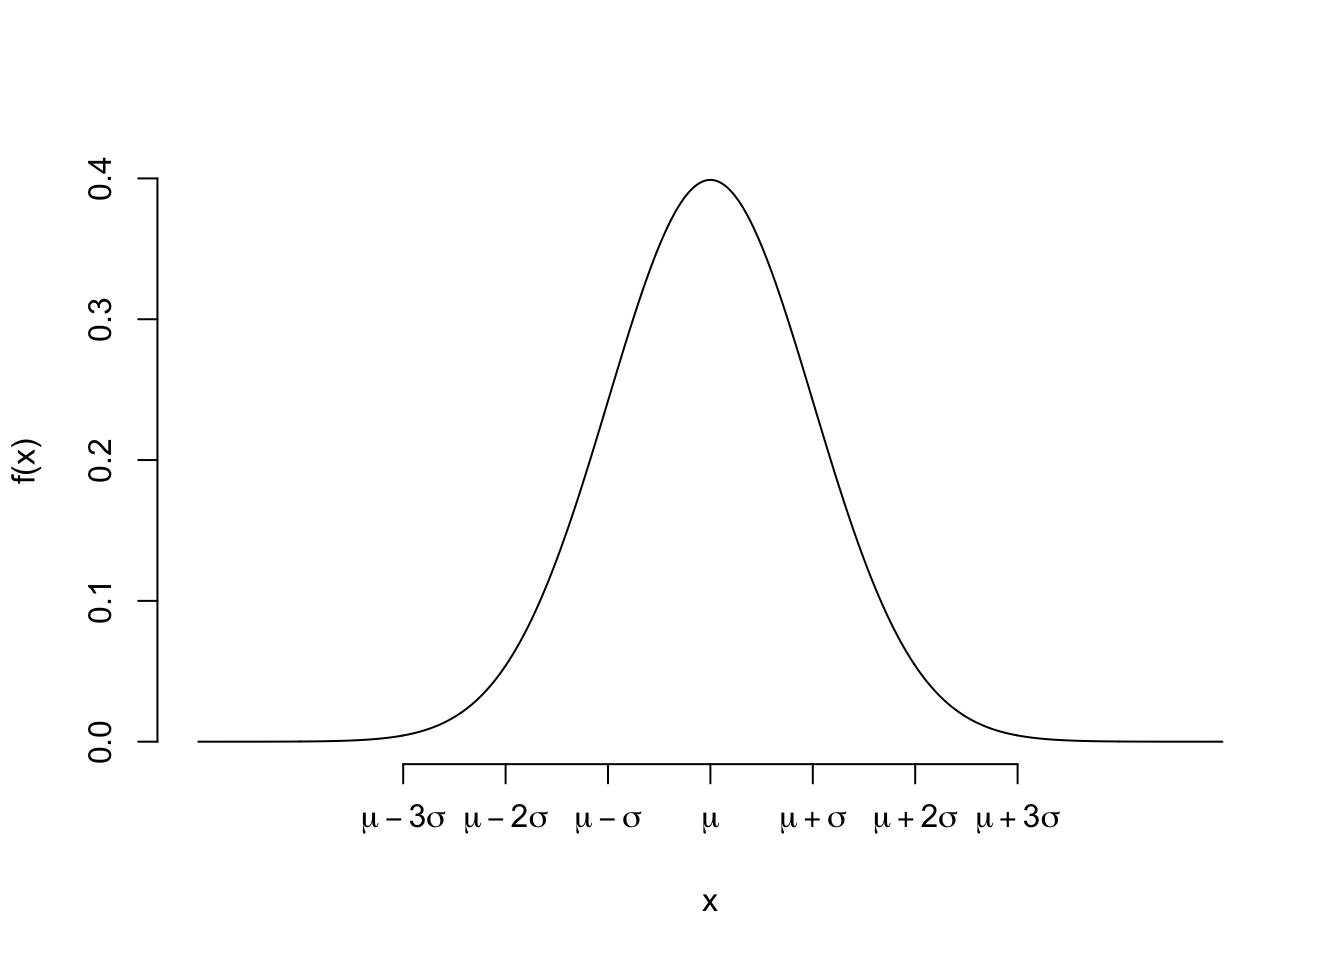
Important: If a random variable can be modeled with a Normal model, then we know that:
- About 68% of the time, the values will be within 1 standard deviation of the expected value.
- About 95% of the time, the values will be within 2 standard deviations of the expected value.
- About 99.7% of the time, the values will be within 3 standard deviations of the expected value.
We will call this the 68-95-99.7 rule.