1.1 What is Data?
Data is anything that contains information. We typically think of data being stored in spreadsheets, but it can come in many other formats such as images or collections of text (whether 280 character tweets or fictional novels).
For example, we can take the pixels of digital images or text from one of the State of the Union addresses and transform them into a tidy, rectangular format. Below we show the top 10 words from the most recent State of the Union address given in the United States (excluding words such as “the”, “and”, “or”, etc.). Notice that we’ve taken a string of text and converted it to rectangular shape with rows and columns. In this case, each row represents one word and the columns we have are the word and the number of times it appears in the text.
## # A tibble: 11 x 2
##    word          n
##    <chr>     <int>
##  1 american     31
##  2 people       26
##  3 americans    24
##  4 tonight      23
##  5 america      18
##  6 country      15
##  7 tax          14
##  8 congress     13
##  9 home         12
## 10 family       10
## 11 world        10
If you are interested in analyzing text as data, check out resources such as Text Mining with R after you complete this course.
One of the first steps of working with any data is to reformat it as a tidy data set.
Tidy data is a table with the following characteristics:
- Each row corresponds to an observation / unit / case (e.g., a person, classroom, country, image, word).
- Each column corresponds to a characteristic or feature or variable for those units (e.g. age, average classroom grade, average county income, intensity of red pixels, number of times the word “together” is used).
Variables can be either categorical or quantitative.
Categorical variable: A characteristic with values that are names of categories; the names of categories could be numbers such as with zipcodes. If the categories have a natural ordering, it may be called an ordinal variable, but we won’t be distinguishing between different types of categorical variables in this class.
Quantitative variable: A characteristic with measured numerical values with units.
Note: Any quantitative variable can be converted into a categorical variable by creating categories defined by intervals or bins of values.
The following graphic from the book R for Data Science, by Garrett Grolemund and Hadley Wickham illustrates the features of tidy data.
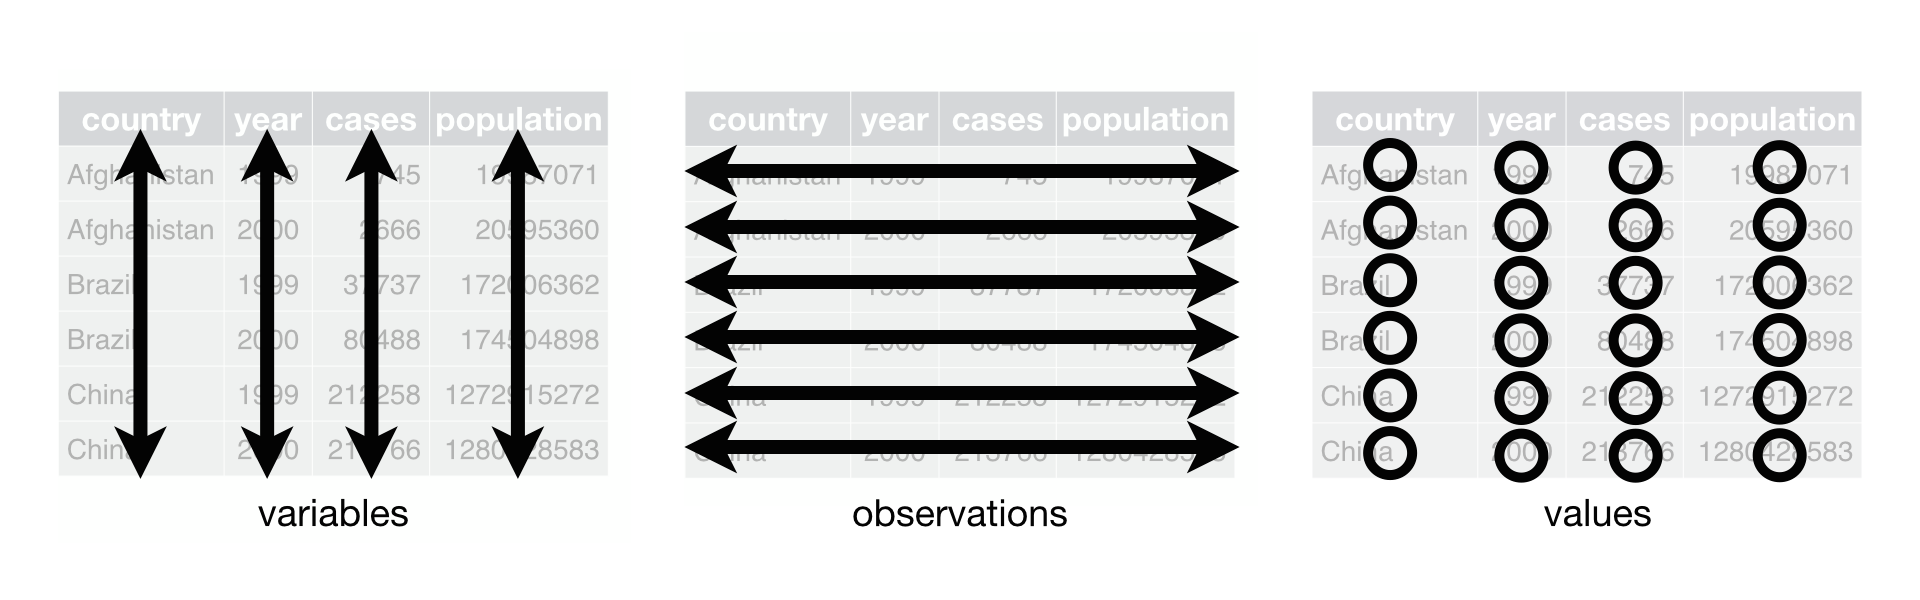
The components of a tidy dataset. Chapter 12 of R for Data Science
The transformation process from raw data to a tidy data format is often called feature extraction and is not a short or easy task. In this introductory course, we will typically work with data that are already in a tidy format.
What the row represents is often referred to as the unit of analysis. As data analysts, it is important for us to consider what to use as the unit of analysis. For example, this may come up when we have information on both individual presidents and their speeches. Do we want to understand matters at the individual level or the speech level? Answers to these questions will depend on the context and the research questions.